
Learn how to build a production-grade Security Operations Center (SOC) automation lab using Wazuh SIEM, TheHive case management, and Shuffle SOAR. This comprehensive guide walks you through creating an end-to-end security monitoring and incident response platform.
What is a Security Operations Center (SOC)?
Security Operations Centers (SOCs) are centralized units that monitor, prevent, detect, investigate, and respond to cyber threats on a 24/7 basis. A modern SOC combines people, processes, and technology to protect an organization’s digital assets.
Common SOC Roles
- SOC Manager: Oversees operations and strategic planning
- SOC Analyst (Tiers 1-3): Monitors alerts and investigates incidents
- SOC Engineers: Builds and maintains security tools
- Incident Responders: Handles active security breaches
- Threat Hunters: Proactively searches for hidden threats
- Forensic Analysts: Investigates security incidents post-breach
- Threat Intelligence Analysts: Analyzes emerging threats
Typical SOC Components
| Component | Purpose |
|---|---|
| SIEM | Security Information and Event Management |
| XDR | Extended Detection and Response |
| SOAR | Security Orchestration, Automation and Response |
| IDS/IPS | Intrusion Detection/Prevention Systems |
| Firewalls | Network traffic filtering |
| Vulnerability Scanners | Identify security weaknesses |
| Ticketing System | Case management |
| Threat Intelligence | External threat data feeds |
Lab Architecture Overview
In this lab, we’ll build a complete SOC automation environment using:
- Wazuh: SIEM and XDR platform
- TheHive: Incident response and case management
- Shuffle: SOAR (Security Orchestration, Automation and Response)
- VirusTotal: Threat intelligence enrichment
- Mimikatz: Simulated threat for testing
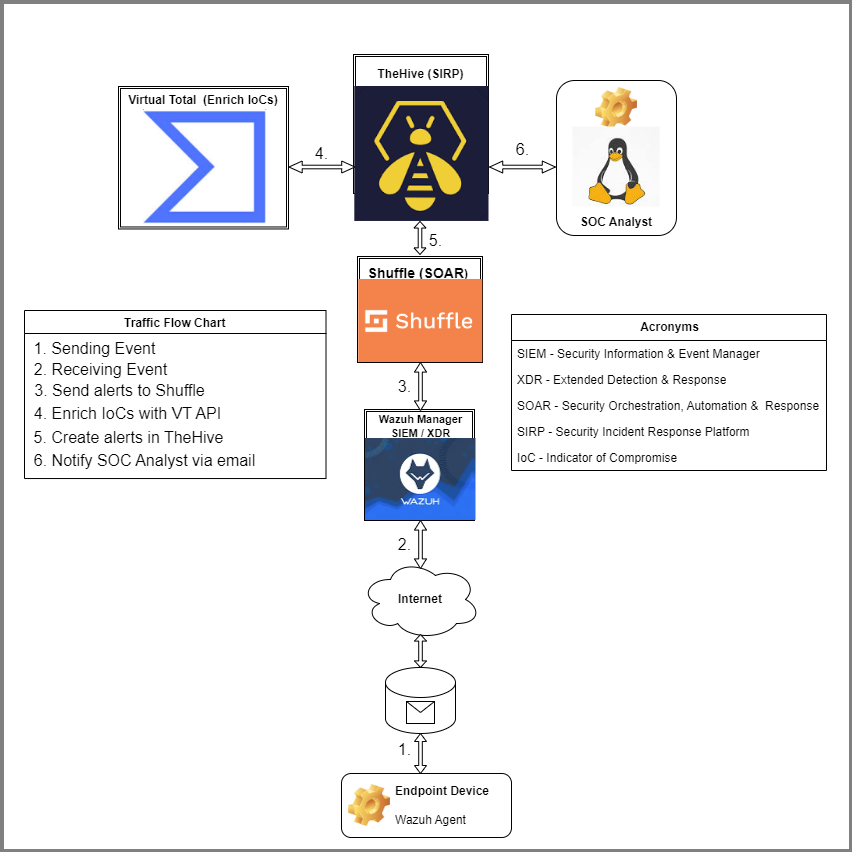
Telemetry Flow
Telemetry refers to the automated collection and transmission of data from remote sources. In our lab:
- Sensors (Wazuh Agent) collect security event data from endpoints
- Data transmission occurs over secure channels to the Wazuh Manager
- Processing and analysis happen at the SIEM layer
- Presentation of findings through dashboards and alerts
- Automation via Shuffle workflows
- Case management in TheHive for incident tracking
Part 1: Windows Agent Setup with Sysmon
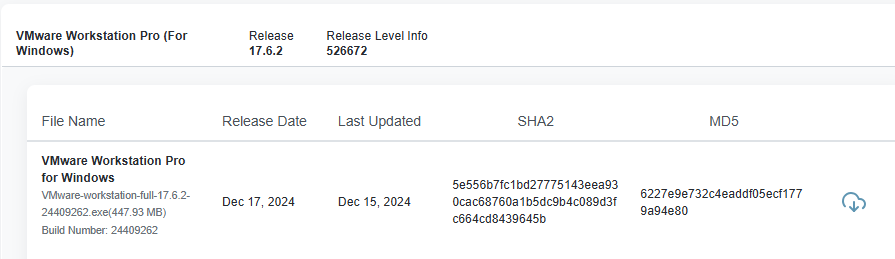
Windows 10 Virtual Machine
We’ll use VMware Workstation Pro 17 to host our Windows 10 agent. VMware has approximately 33% market share and provides excellent features for security labs.
VM Specifications:
- OS: Windows 10 (any edition)
- Storage: 128 GB
- RAM: 4 GB
- Processors: 1
Installing Sysmon for Enhanced Logging
Sysmon (System Monitor) is a Windows system service from Microsoft Sysinternals that monitors and logs system activity, providing detailed telemetry for security analysis.
Sysmon Monitoring Capabilities:
- Process creation and termination
- Network connections
- File creation, deletion, and modification
- Driver and DLL loading
- Raw disk access events
- Registry modifications
- Image loads
- Pipe events
- WMI events
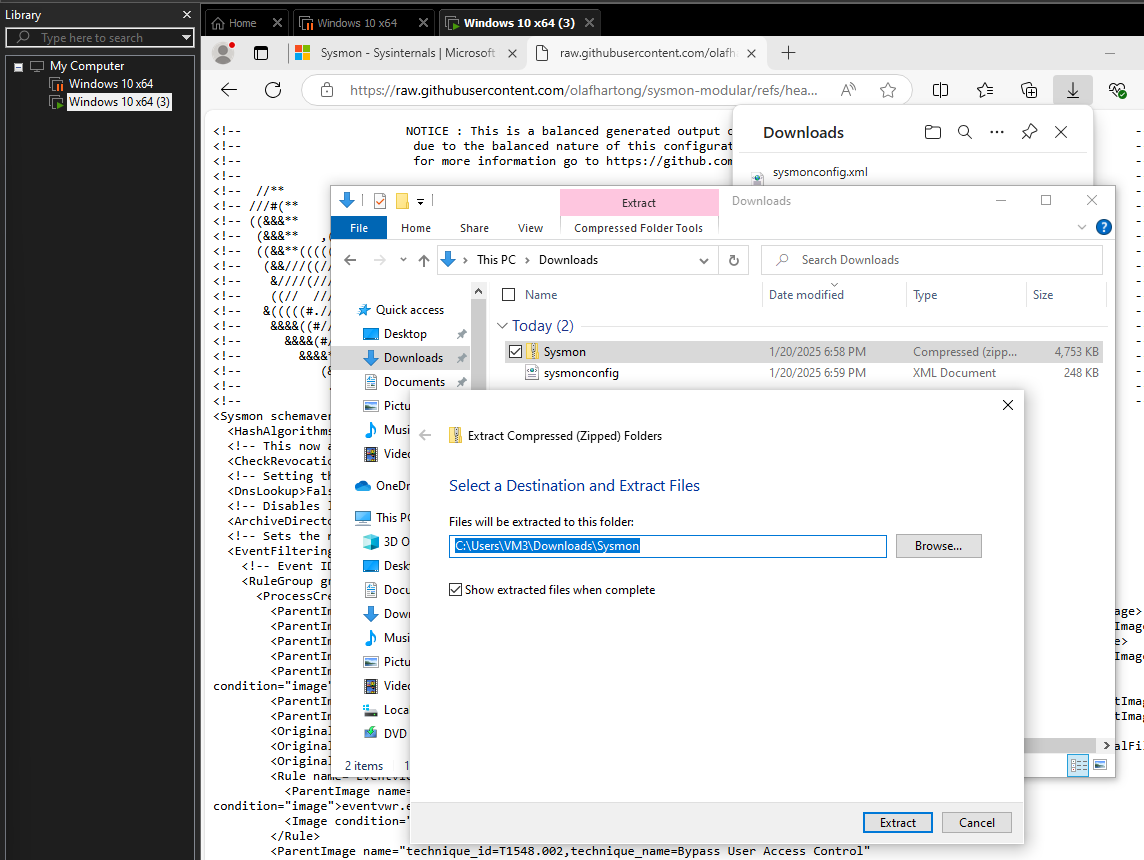
Installation Steps:
- Download Sysmon from Microsoft Sysinternals
- Download a Sysmon configuration file (sysmonconfig.xml)
- Open PowerShell as Administrator
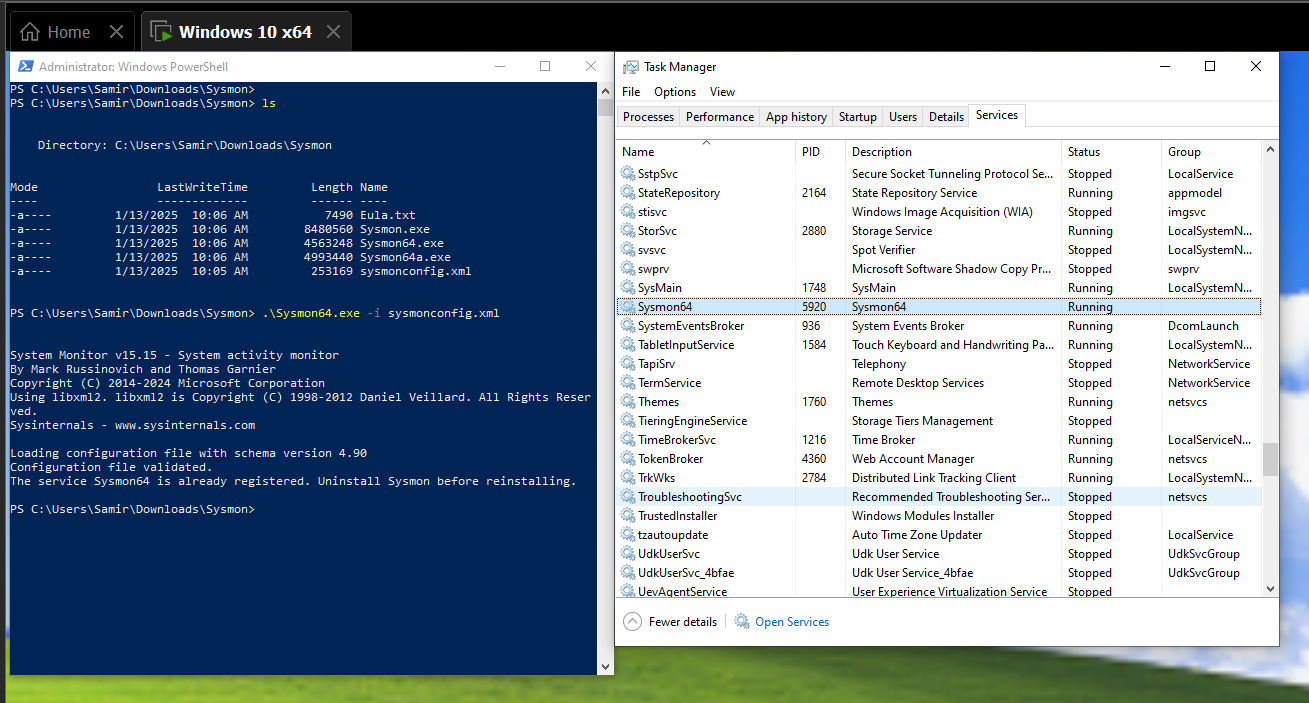
- Install Sysmon with configuration:
1
.\Sysmon64.exe -accepteula -i sysmonconfig.xml
- Verify Sysmon is running:
1
Get-Service Sysmon64
The service should show as “Running”. You now have a fully functional Windows VM with enhanced logging capabilities.
Installing VMware Tools
VMware Tools adds critical functionalities:
- Time synchronization with the host
- Automated script execution
- Secure communication between VM and host
- Optimized drivers for better performance
- Seamless mouse and keyboard integration
Installation:
- VM Menu → Install VMware Tools
- Open File Explorer → D: drive
- Run
setup64.exe - Follow the installation wizard
Part 2: Cloud Infrastructure with Digital Ocean
Understanding Wazuh Components
Wazuh is an open-source security platform with four main components:
- Wazuh Agent: Installed on endpoints to collect security data
- Wazuh Manager/Server: Receives and processes data from agents
- Wazuh Indexer: Search engine that stores alerts (based on Elasticsearch)
- Wazuh Dashboard: Web interface for visualization and analysis
Understanding TheHive Components
TheHive is a scalable incident response platform consisting of:
- TheHive Server: Core platform for case management
- Cortex: Analysis engine that runs observables through analyzers
- MISP Integration: Malware Information Sharing Platform for threat intelligence
Integration Workflow:
1
2
3
4
5
MISP → Threat Indicators (IoCs, TTPs) → TheHive
     ↓
VirusTotal → Malware/URL Analysis → Cortex → TheHive
     ↓
Observables (IPs, Hashes) → Analysis Results → Case Evidence
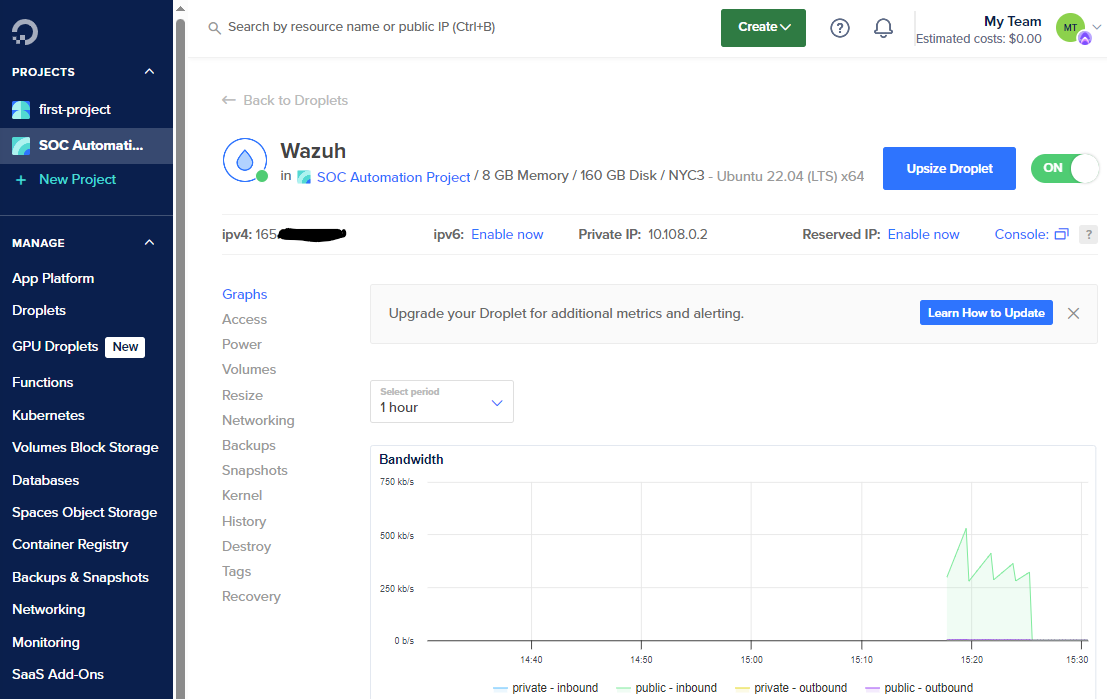
Setting Up Digital Ocean Droplets
Digital Ocean provides a straightforward cloud platform for deploying and managing applications. We’ll create two droplets (cloud VMs): one for Wazuh and one for TheHive.
Droplet Configuration:
- Location: Choose your preferred datacenter
- Operating System: Ubuntu 22.04 LTS (Long-Term Support)
- Resources: 8 GB RAM minimum (for each droplet)
- Authentication: SSH key (recommended) or password
- Firewall: Configure to allow only your public IP address
What is a Droplet? A droplet is a scalable virtual machine that runs on virtualized hardware, functioning as an independent server for hosting applications, databases, or services.
Configuring the Firewall
A firewall monitors and controls network traffic based on predetermined security rules, acting as a barrier between trusted internal networks and untrusted external networks.
Think of it like a security guard at a building entrance—unauthorized visitors are stopped before they can proceed further.
Firewall Functions:
- Packet Filtering: Examines individual packets
- Stateful Inspection: Tracks connection states
- Proxy Services: Acts as intermediary for requests
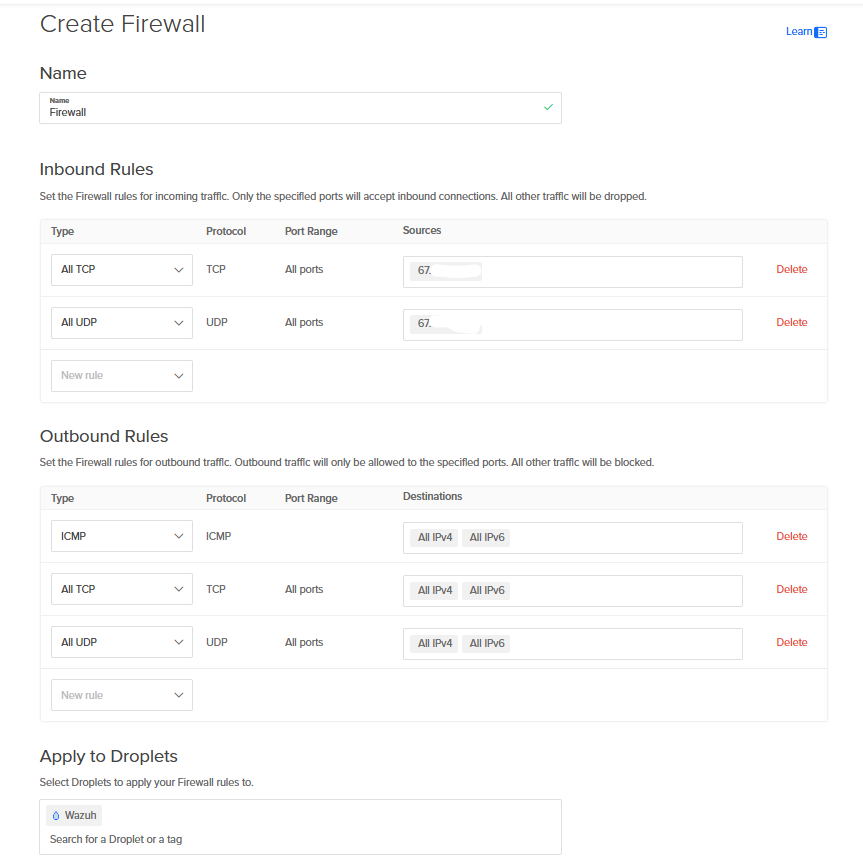
Important: Add your ISP-issued public IP address to the firewall whitelist to allow SSH connections.
Part 3: TheHive Installation and Configuration
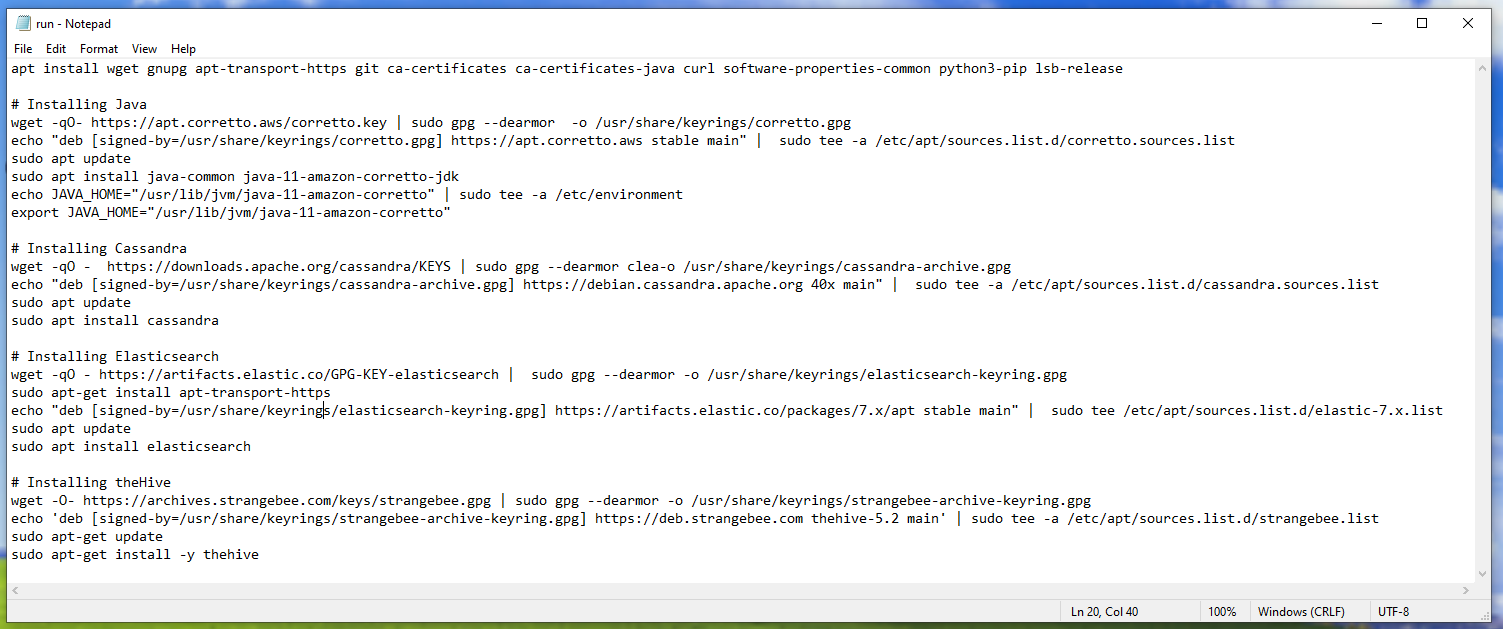
Quick Installation Script
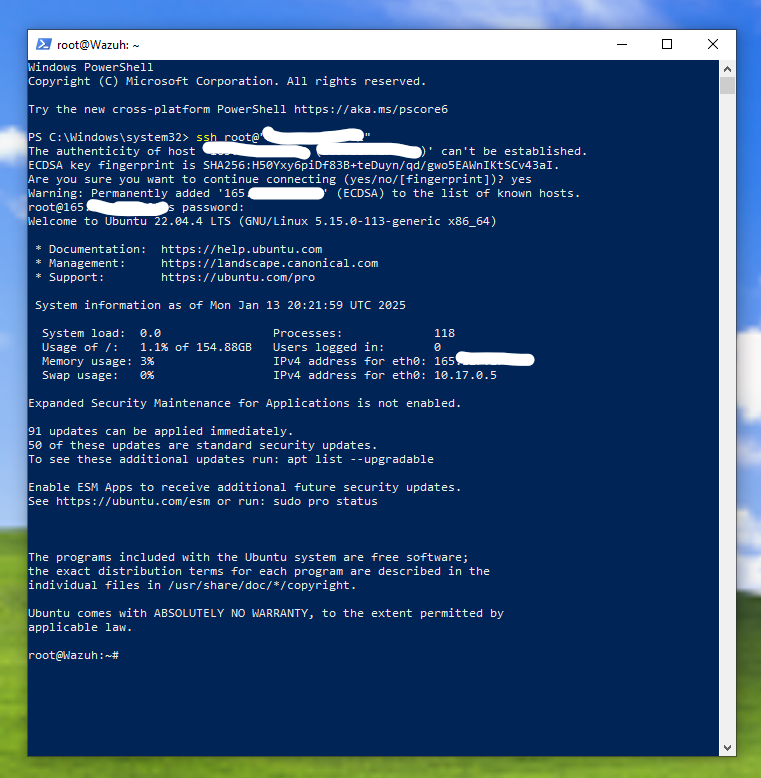
Instead of running commands one by one, create an installation script:
- SSH into your TheHive droplet
- Navigate to
/etcdirectory - Create a script file:
1
sudo nano install-thehive.sh
- Add all installation commands
- Save with
Ctrl + O, exit withCtrl + X - Make executable:
1
chmod +x install-thehive.sh
- Run the script:
1
./install-thehive.sh
Note: If you encounter “Daemons using outdated libraries” prompt, press Enter on dbus.service.
Understanding Dependencies
Dependencies are external components, libraries, or modules that software requires to function correctly.
Examples:
- Website → Animation library for visual effects
- Game → Sound library for audio playback
- Security platform → Database for data storage
TheHive Dependencies:
- Java: Runtime environment
- Apache Cassandra: Primary database
- Elasticsearch: Search and indexing engine
- Utilities: git, curl, wget, pip
Configuring Apache Cassandra
Cassandra is TheHive’s primary database, storing:
- Alert data
- Incident records
- Log data
- Threat intelligence
- User activity data
- Configuration settings
- Vulnerability data
Configuration Steps:
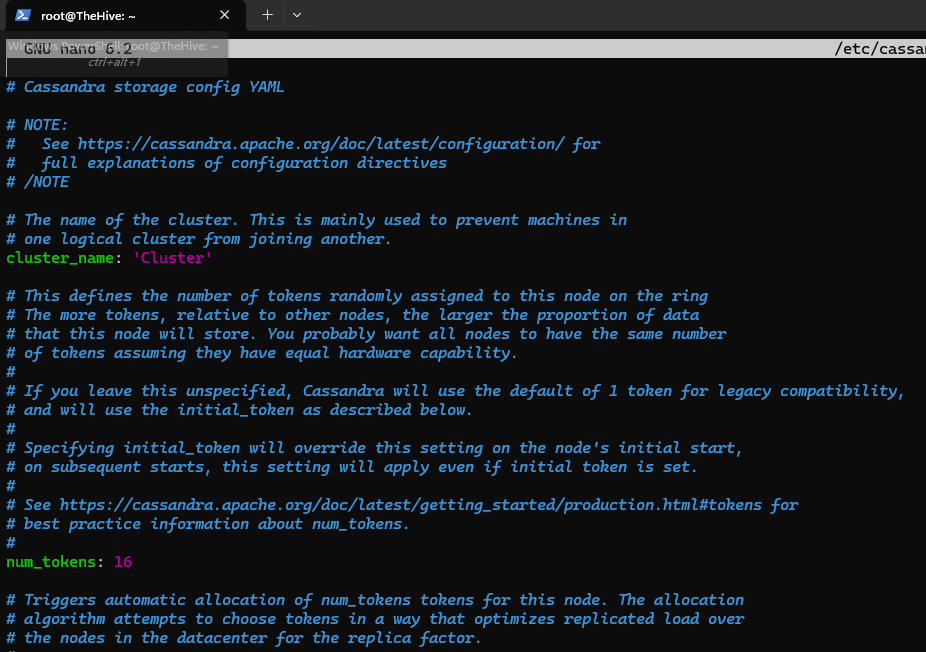
- Edit the Cassandra configuration:
1
sudo nano /etc/cassandra/cassandra.yaml
- Modify these settings:
1
2
3
4
listen_address: <TheHive_Public_IP>
rpc_address: <TheHive_Public_IP>
seeds: "<TheHive_Public_IP>"
cluster_name: 'TheHive_Cluster'
- Restart and verify the service:
1
2
sudo systemctl restart cassandra
sudo systemctl status cassandra
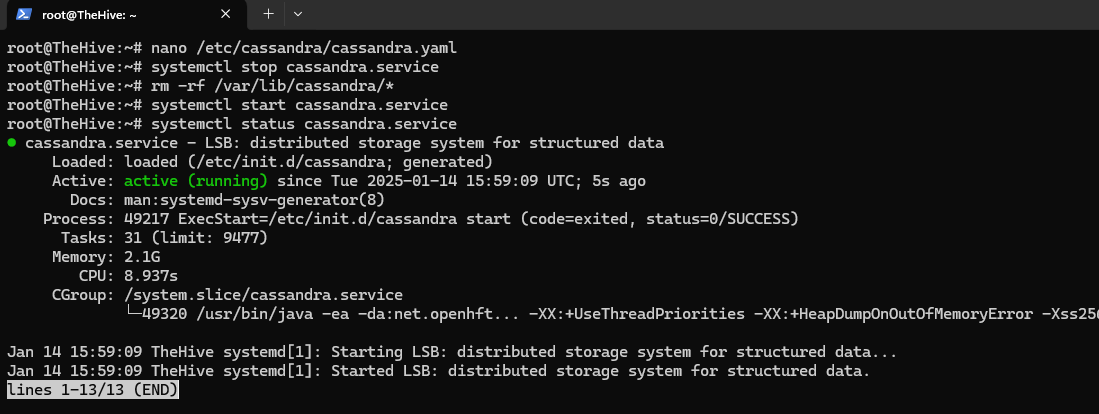
The status should show active (running).
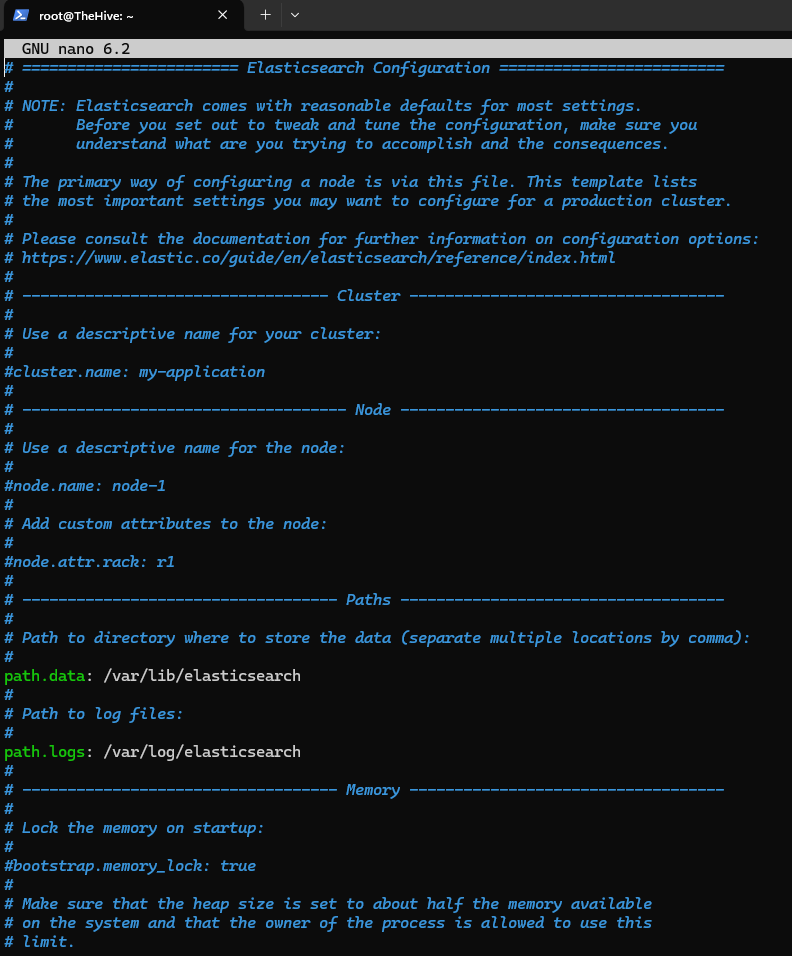
Configuring Elasticsearch
Elasticsearch is a search engine used for indexing and searching large volumes of data, including alerts, cases, and observables.
Configuration File: Both .yml and .yaml extensions work identically; .yaml is more commonly used.
1
sudo nano /etc/elasticsearch/elasticsearch.yml
Required Changes:
1
2
3
4
5
cluster.name: thehive-cluster  # Different from Cassandra cluster name
node.name: thehive-node-1
network.host: <TheHive_Public_IP>
http.port: 9200
cluster.initial_master_nodes: ["thehive-node-1"]  # Remove second node
Configuring TheHive
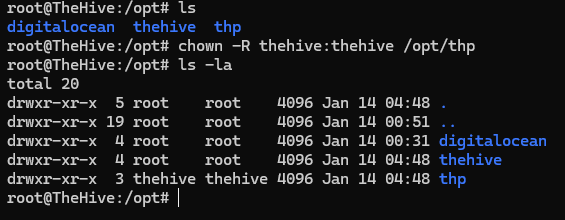
Directory Ownership Configuration:
The chown command changes ownership of files and directories. The -R flag applies changes recursively to all subdirectories.
1
sudo chown -R thehive:thehive /opt/thp
TheHive Application Configuration:
1
sudo nano /etc/thehive/application.conf
Required Settings:
1
2
3
4
5
6
7
8
9
10
11
12
13
14
15
db.janusgraph {
  storage {
    backend: cql
    hostname: ["<TheHive_Public_IP>"]
    cql {
      cluster-name: TheHive_Cluster  # Match Cassandra cluster name
    }
  }
  index.search {
    backend: elasticsearch
    hostname: ["<TheHive_Public_IP>"]
  }
}

application.baseUrl: "http://<TheHive_Public_IP>:9000"
Part 4: Troubleshooting Common Errors
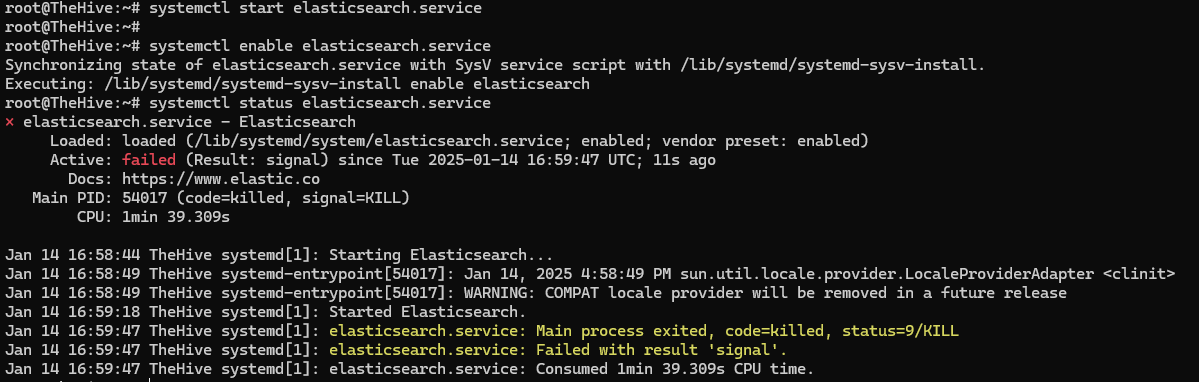
Elasticsearch OOM (Out of Memory) Error
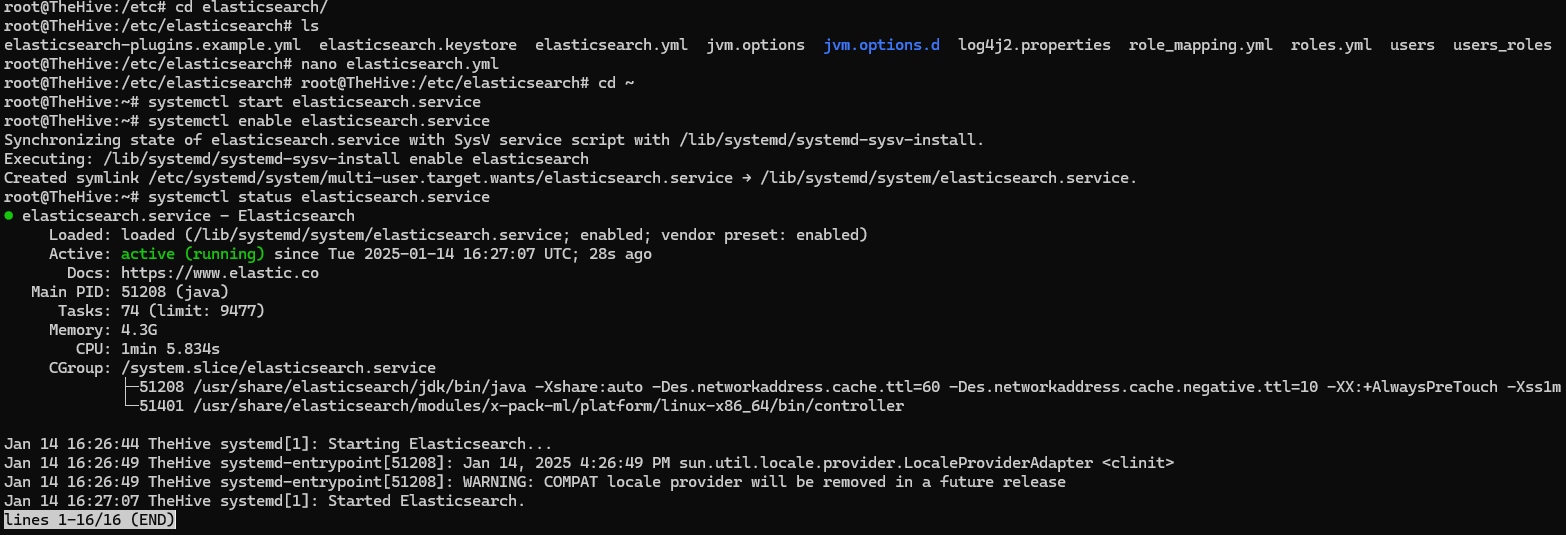
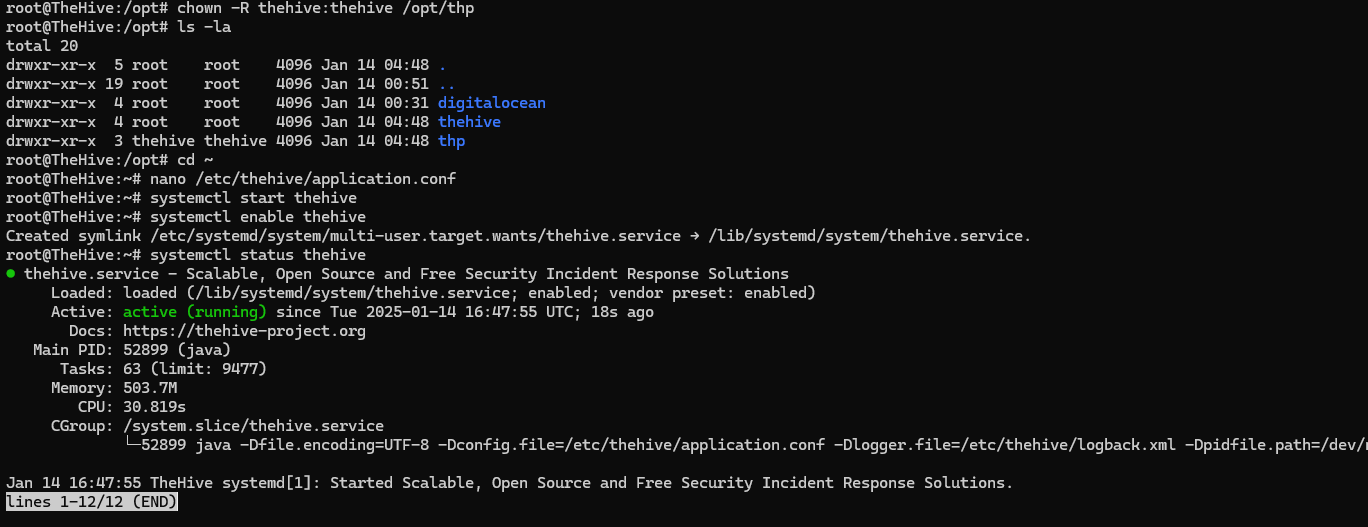
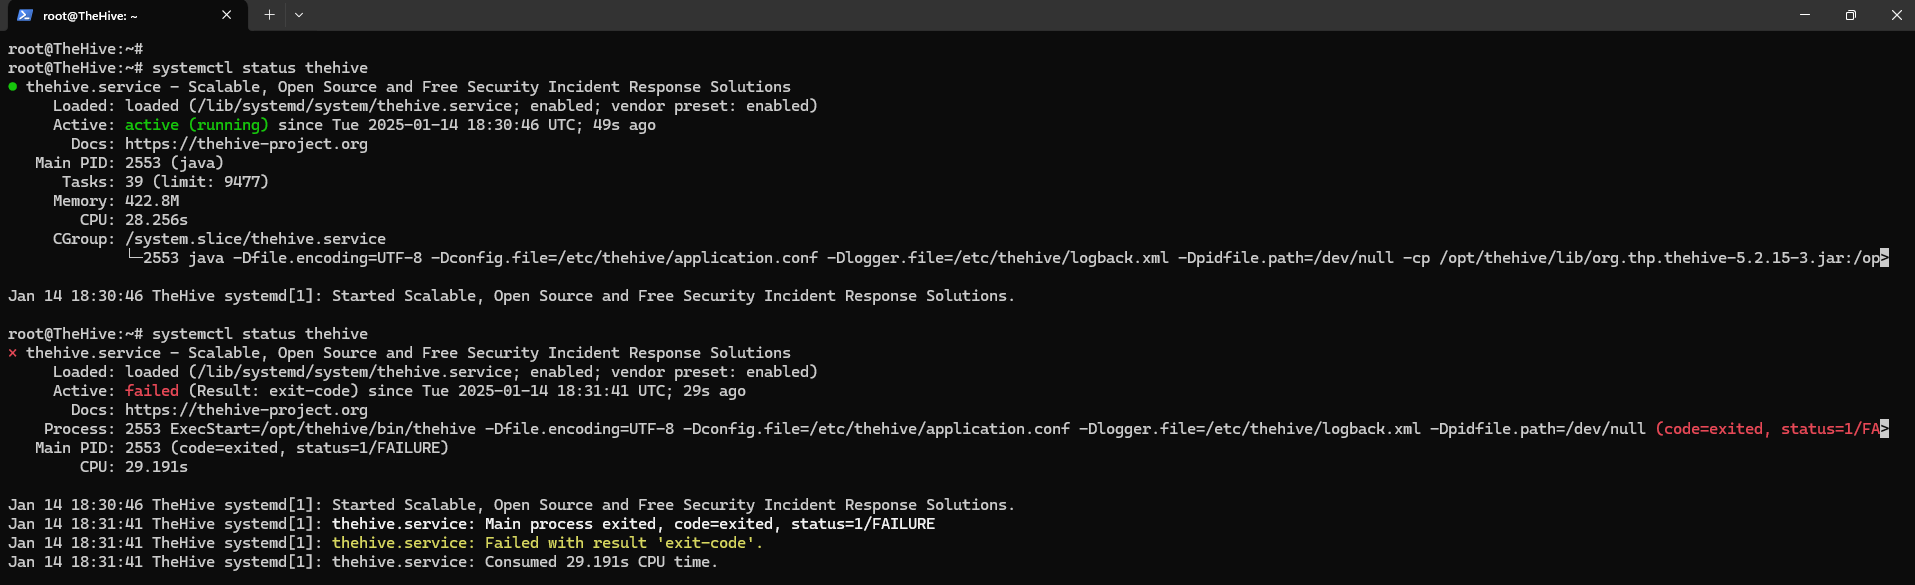
When verifying services, you may notice Elasticsearch failed to start:
1
sudo systemctl status elasticsearch thehive cassandra
Investigating with journalctl:
1
sudo journalctl -xe
-x: Provides detailed context for log messages-e: Jumps to the end of the journal (most recent entries)
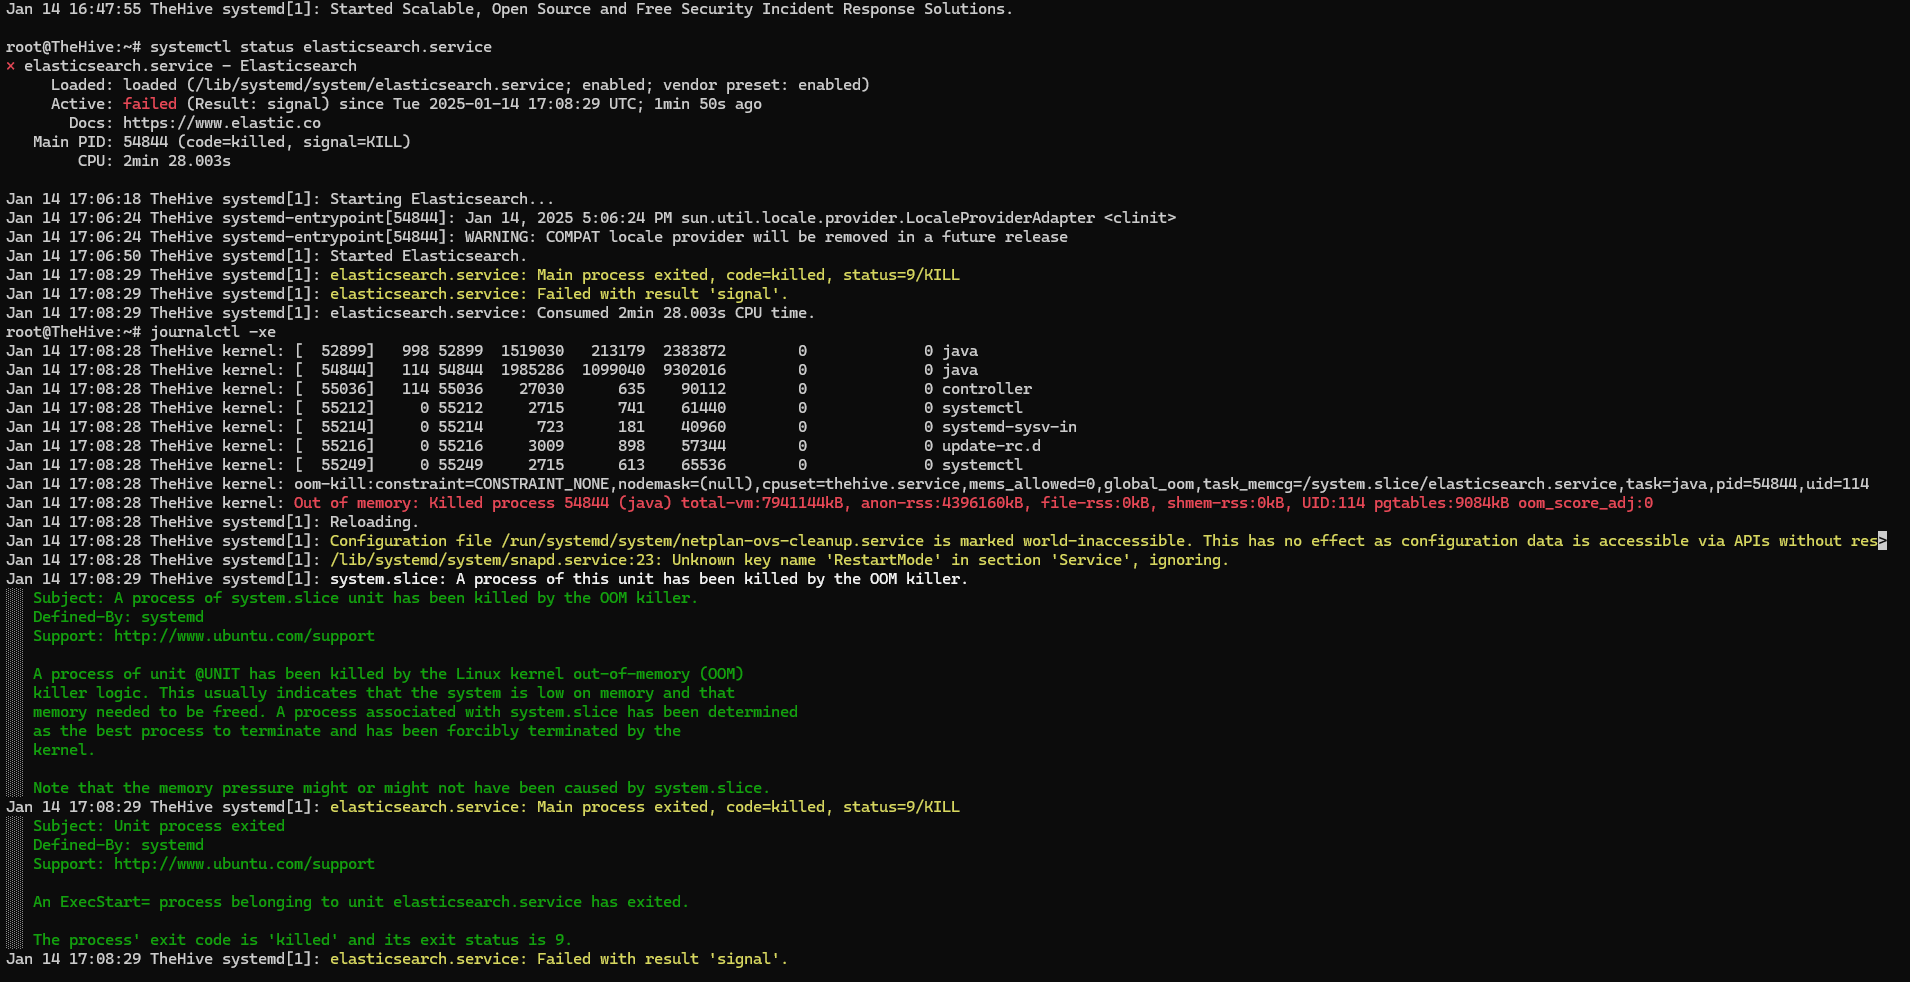
Diagnosis: Elasticsearch’s Java process was killed by the OOM (Out of Memory) killer. The system sacrificed Elasticsearch to free up RAM.
Solution: Increase droplet RAM to 8 GB or configure Elasticsearch heap size.
TheHive Connection Refused Error
Error: ERR_CONNECTION_REFUSED when accessing TheHive web interface.
This indicates:
- The service isn’t running
- The port (9000) is not open
- Firewall is blocking the connection
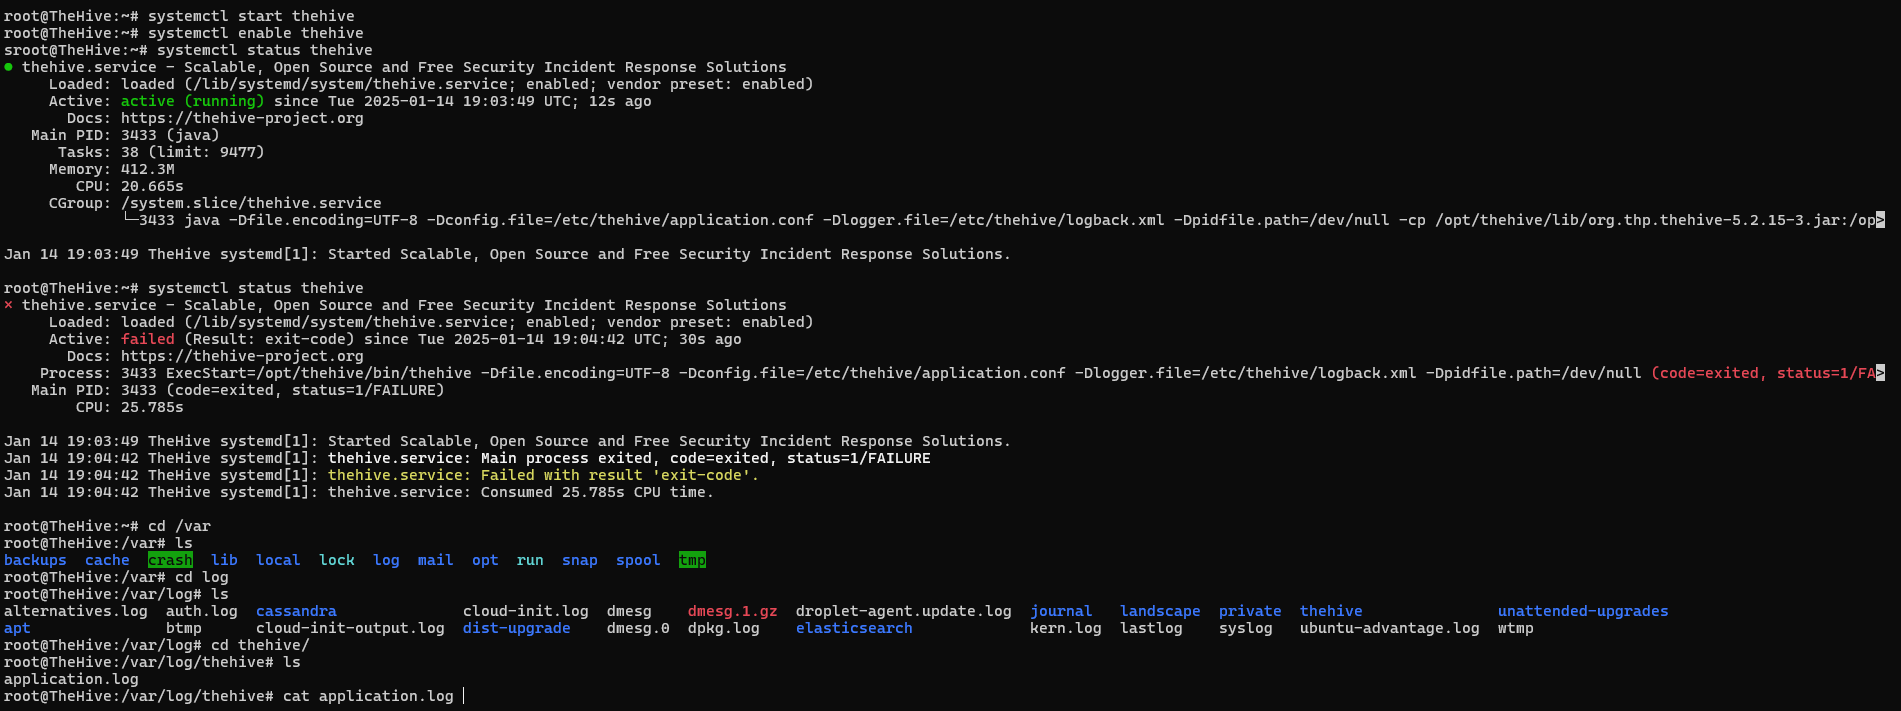
Advanced Troubleshooting:
journalctl only shows systemd’s view. For deeper investigation, check application logs:
1
2
sudo cat /var/log/thehive/application.log | grep -i error
sudo cat /var/log/thehive/application.log | grep -i exception
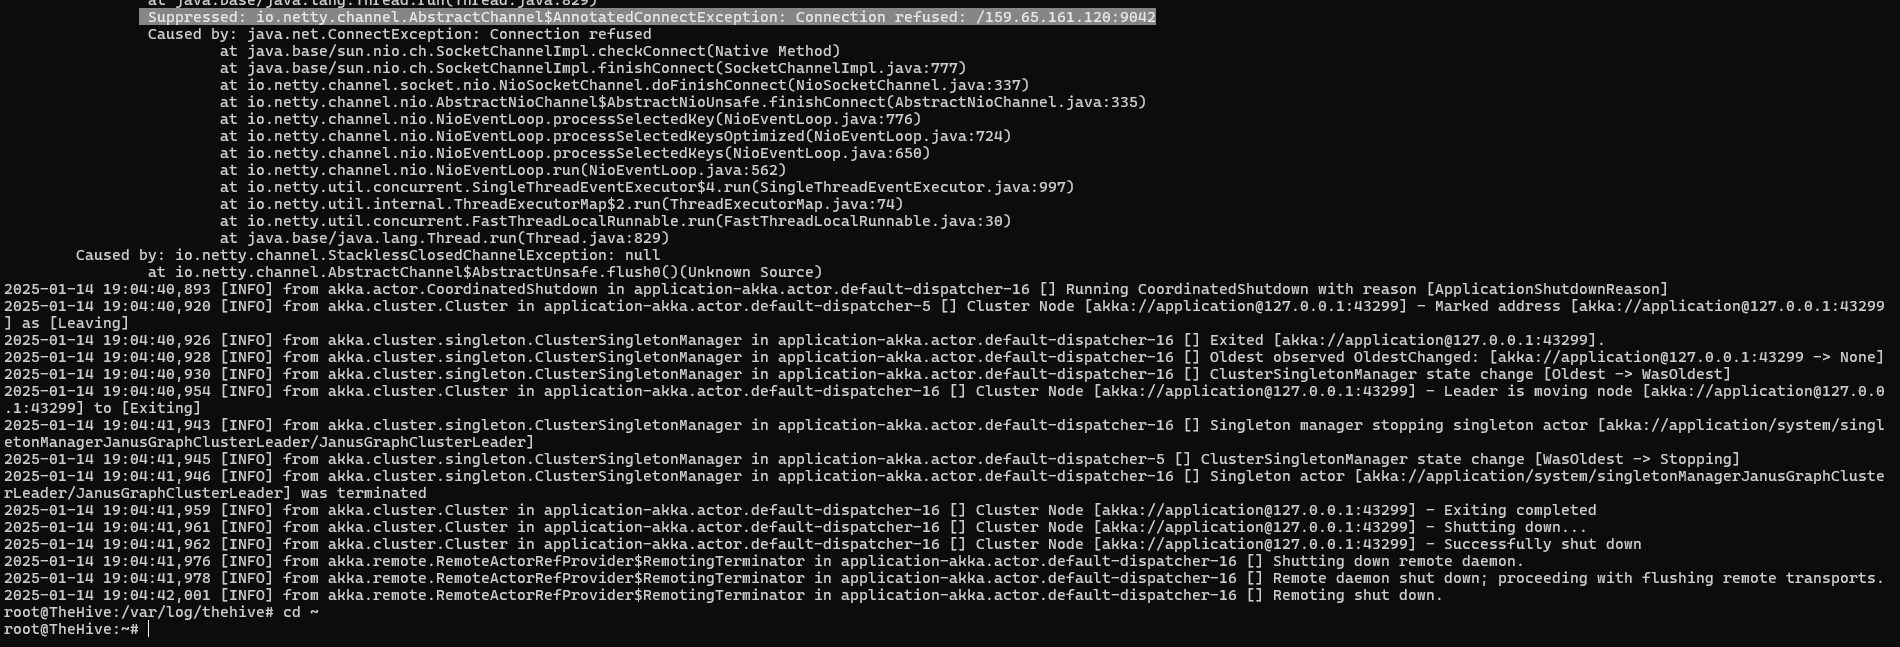
Root Cause: JanusGraph (TheHive’s graph database layer) couldn’t connect to Cassandra on port 9042. TheHive requires its backend storage connection before it can start.
Solution:
1
2
3
4
5
sudo systemctl restart cassandra
sleep 10
sudo systemctl restart elasticsearch
sleep 10
sudo systemctl restart thehive
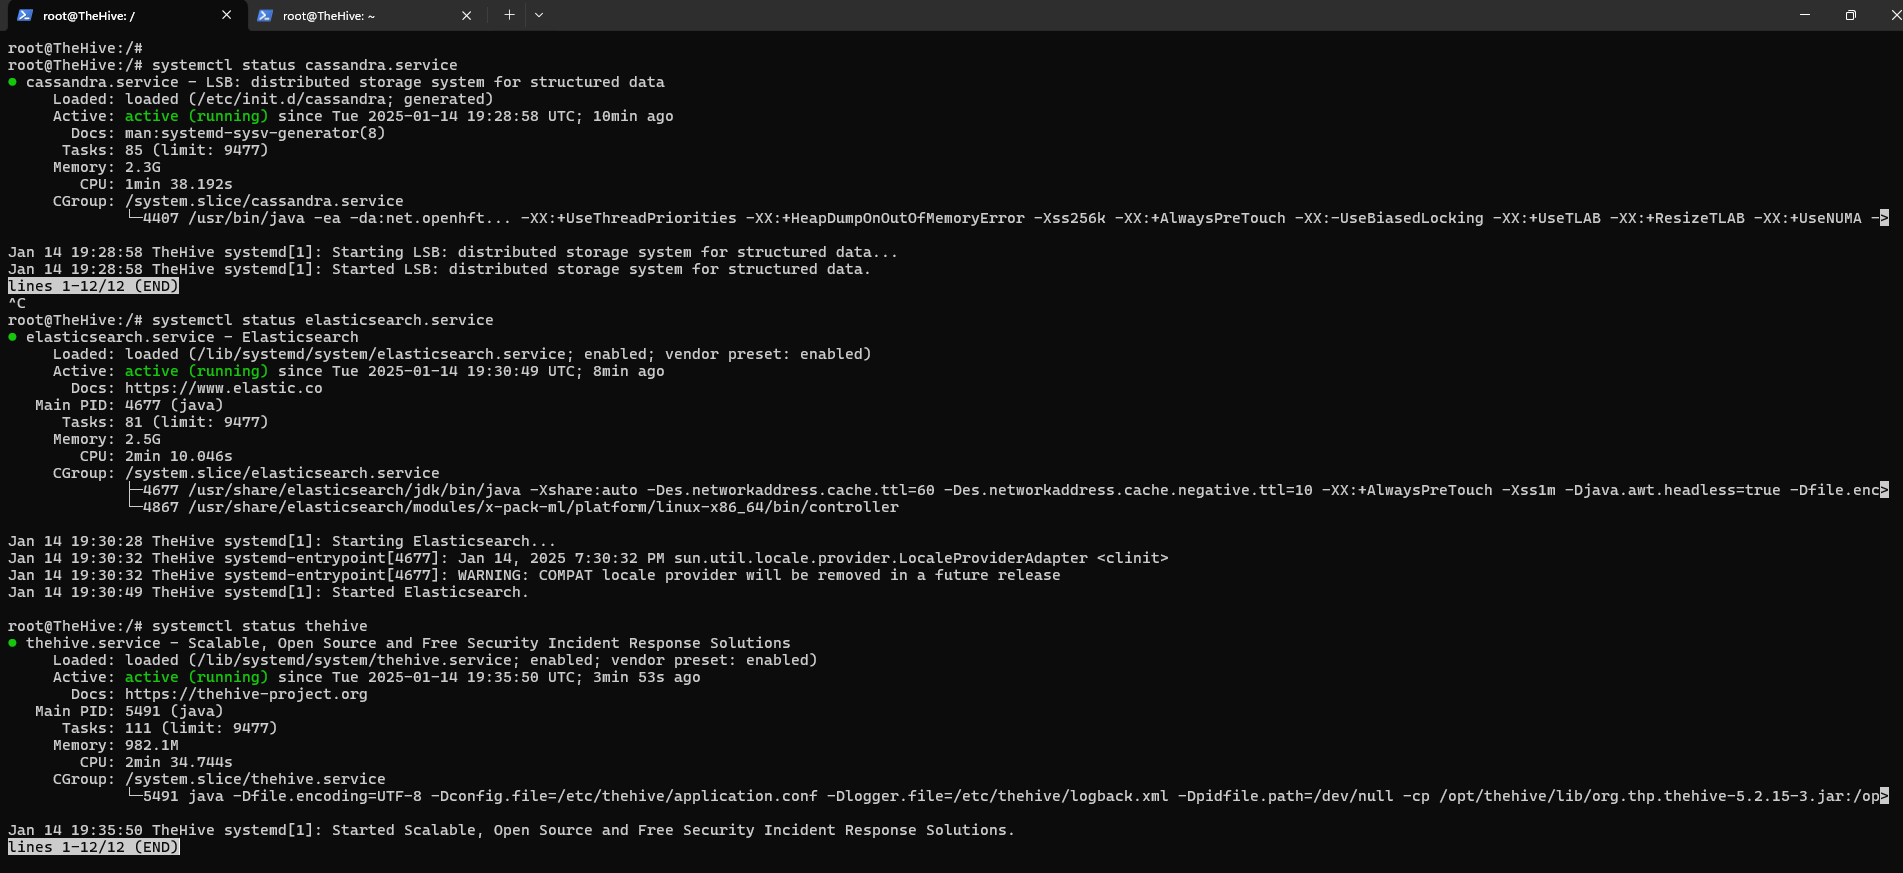
Accessing TheHive
Navigate to http://<TheHive_Public_IP>:9000
Default Credentials:
- Username:
admin@thehive.local - Password:
secret
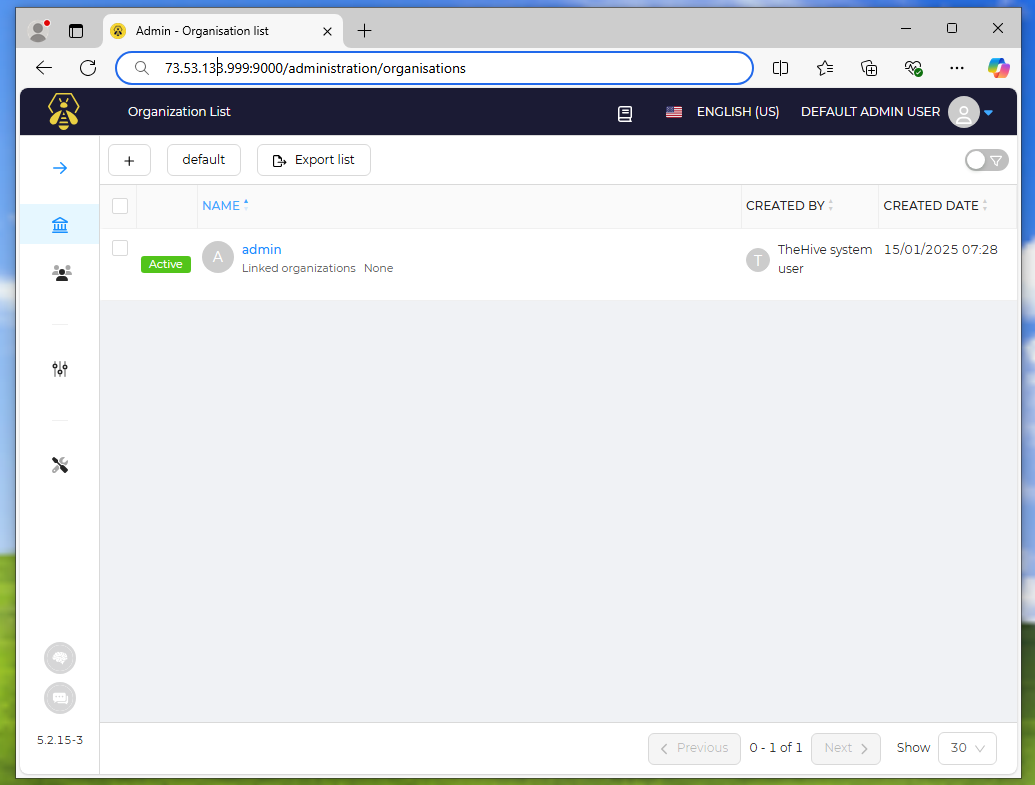
Important: Change the default password immediately after first login.
Part 5: Wazuh Agent Configuration
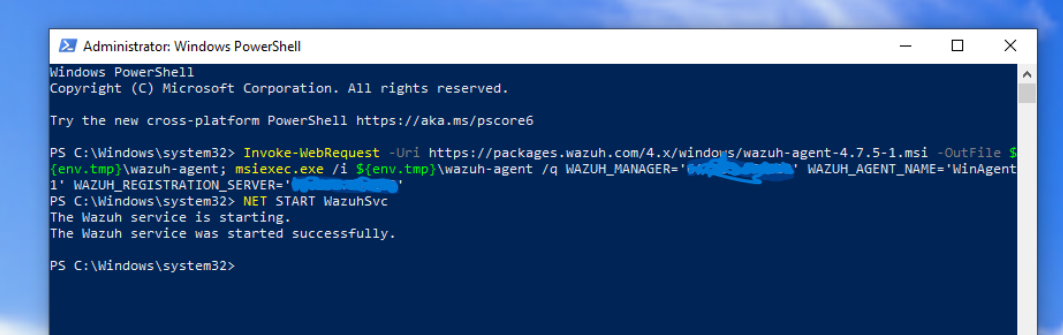
Installing Wazuh Agent on Windows
- Access the Wazuh Dashboard
- Navigate to Agents → Add Agent
- Select Windows as the operating system
- Copy the PowerShell installation command
- Run PowerShell as Administrator on your Windows VM
- Paste and execute the command
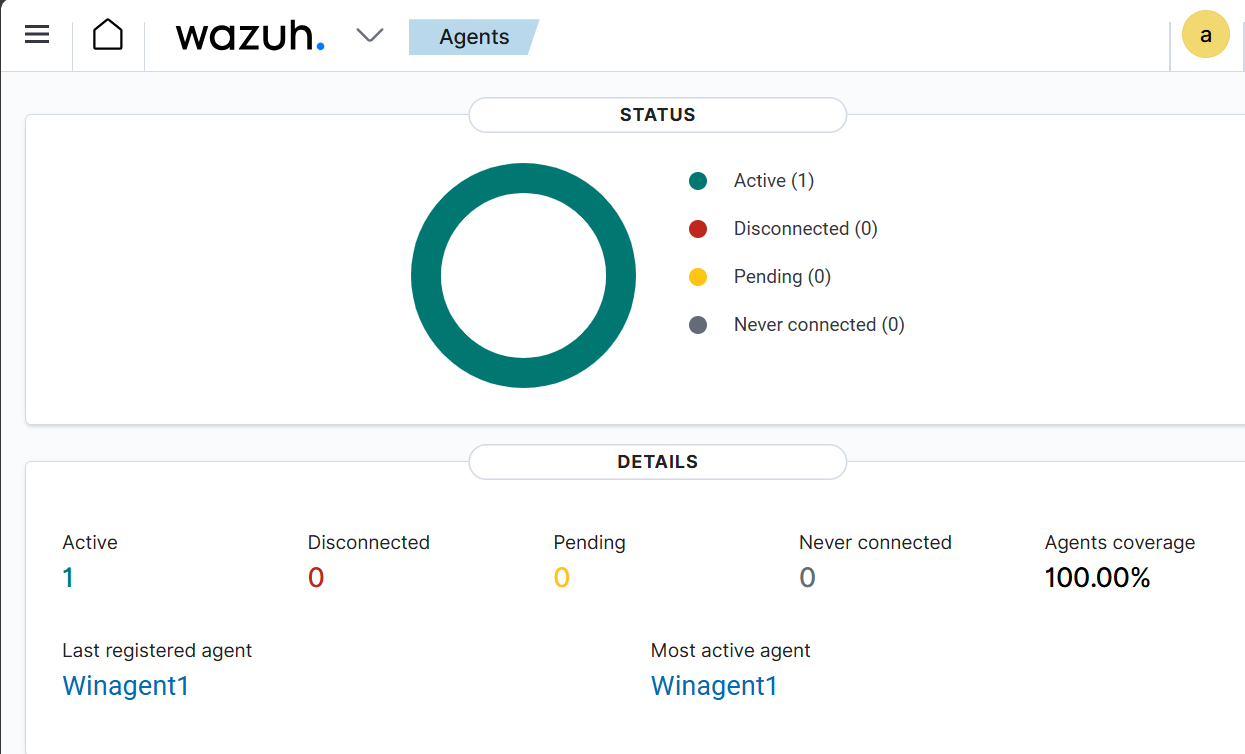
Verifying Agent Connection
Check the Wazuh Dashboard—it should display 1 connected agent.
Configuring OSSEC for Sysmon Integration
ossec.conf is the primary configuration file for OSSEC (Wazuh’s core engine), defining behavior and settings for both manager and agents.
File Locations:
- Linux:
/var/ossec/etc/ossec.conf - Windows:
C:\Program Files (x86)\ossec-agent\ossec.conf
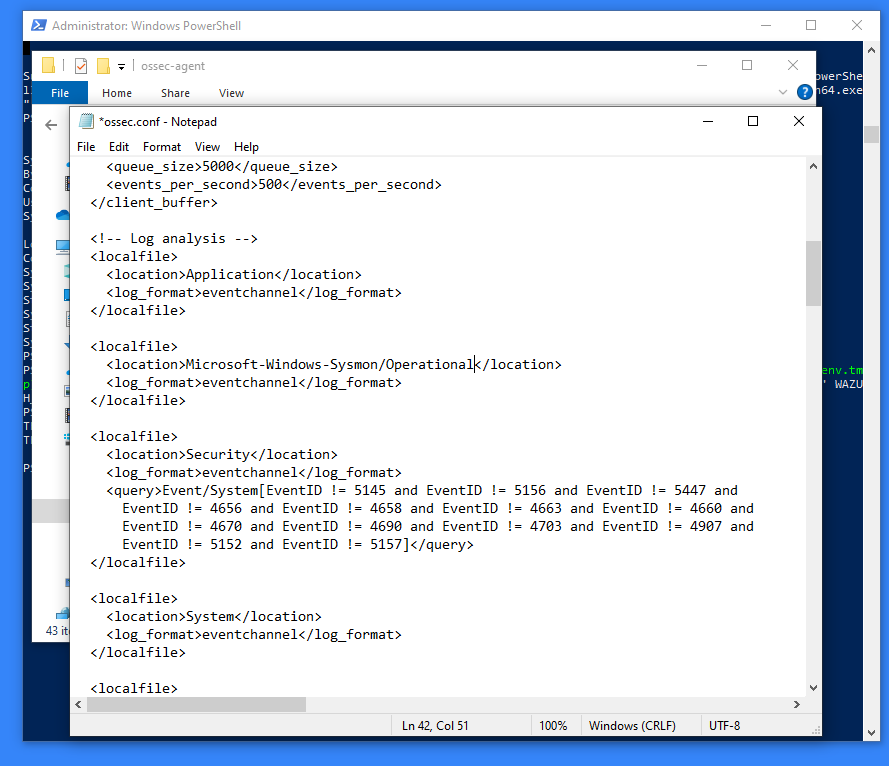
Add Sysmon Monitoring:
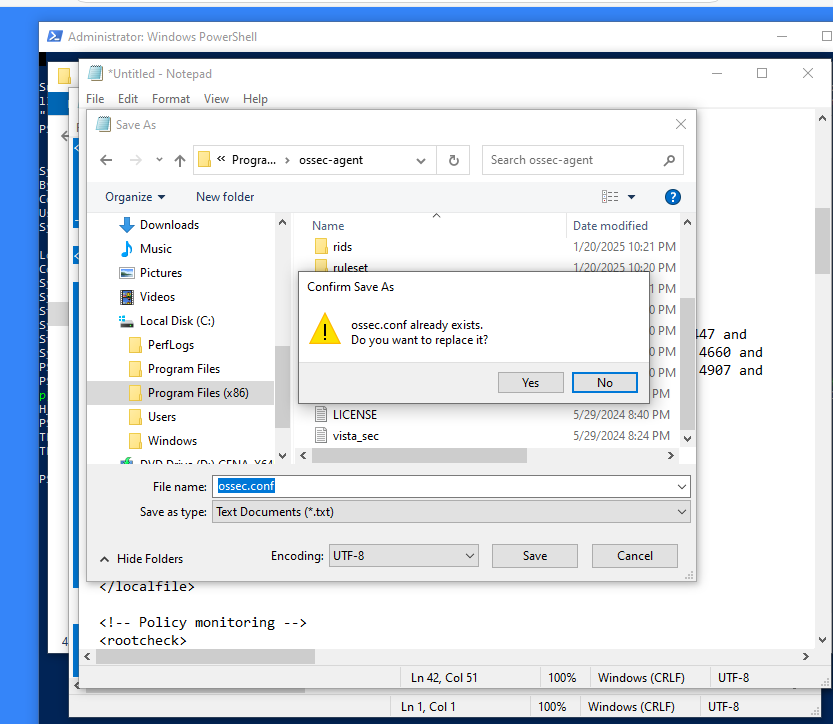
- Open
ossec.confin Notepad (as Administrator) - Add the following configuration:
1
2
3
4
<localfile>
  <location>Microsoft-Windows-Sysmon/Operational</location>
  <log_format>eventchannel</log_format>
</localfile>
Configuration Explanation:
<localfile>: Defines a new log source to monitor<location>: Specifies the Windows Event Channel (Sysmon logs)<log_format>: Indicates this is an event channel format
Finding the Exact Channel Name:
- Open Event Viewer
- Navigate to: Applications and Services Logs → Microsoft → Windows → Sysmon
- Right-click Sysmon → Properties
- Copy the full channel name
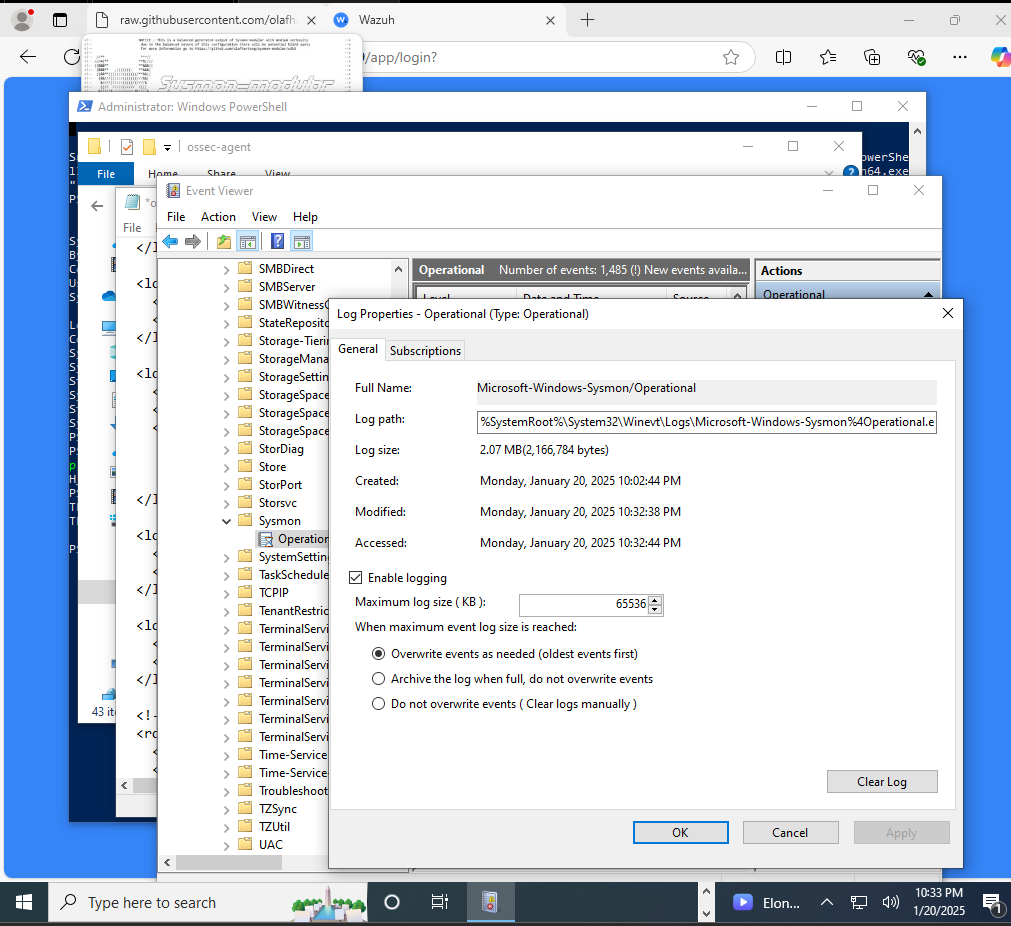
- Restart the Wazuh agent service
Benefits: This configuration allows Wazuh to capture and analyze all Sysmon events, including:
- Process creation
- Network connections
- File modifications
- Registry changes
Part 6: Simulating Threats with Mimikatz
Understanding Mimikatz
Mimikatz is a post-exploitation tool that extracts authentication credentials from Windows systems. While often used by attackers, it’s valuable for security testing and understanding credential theft techniques.
Key Capabilities:
| Technique | Description | Impact |
|---|---|---|
| Credential Dumping | Extracts plaintext passwords, hashes, PINs, and Kerberos tickets from memory | Direct credential theft |
| Pass the Hash | Authenticates without the plaintext password using NTLM hashes | Lateral movement |
| Pass the Ticket | Captures and reuses Kerberos tickets | Impersonation attacks |
| Golden Ticket | Creates forged Kerberos tickets with unlimited access | Domain-wide persistence |
| Pass the Key | Uses password hashes to request Kerberos tickets | Stealthy authentication |
MITRE ATT&CK Mapping: T1003 (OS Credential Dumping)
Important Note: Patch management is critical. Mimikatz exploits known vulnerabilities that are often already patched in up-to-date systems.
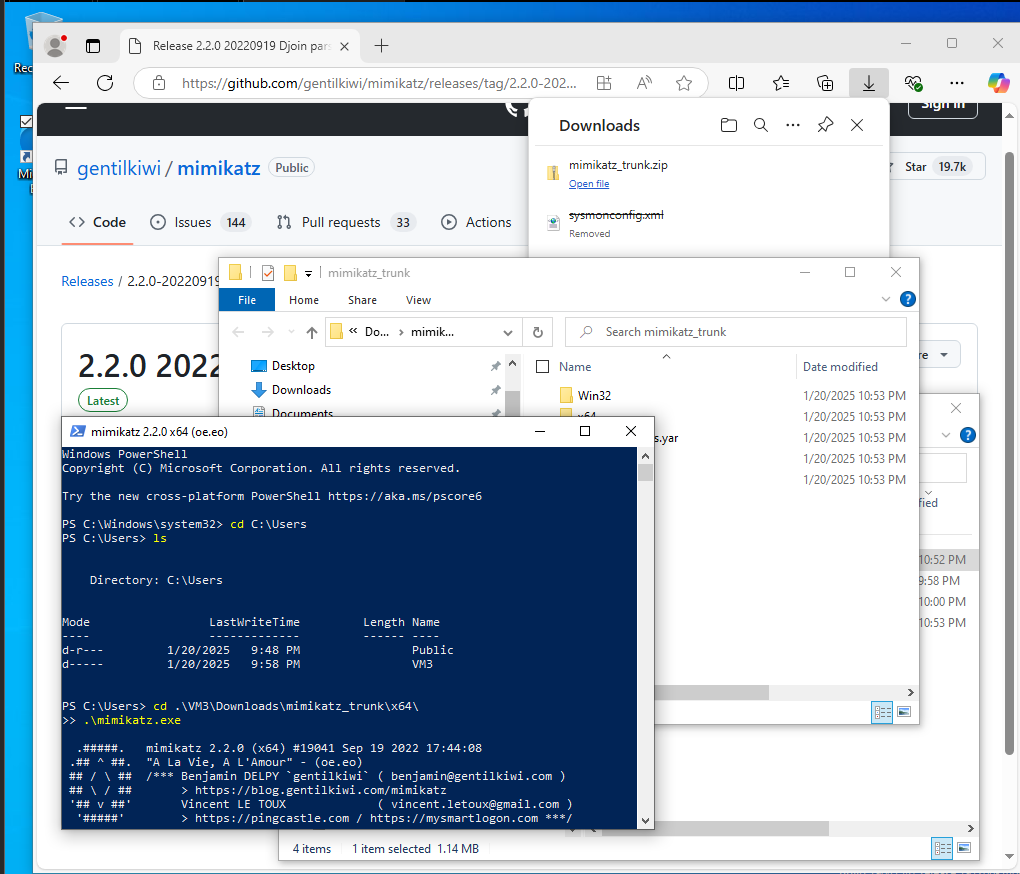
Downloading and Configuring Mimikatz
- Download Mimikatz from the official GitHub repository
- Exclude from Windows Defender (for lab purposes only):
- Windows Security → Virus & Threat Protection
- Manage Settings → Exclusions
- Add the Downloads folder
- Extract the ZIP file
Security Note: In a production environment, never disable antivirus protection. This is strictly for controlled lab testing.
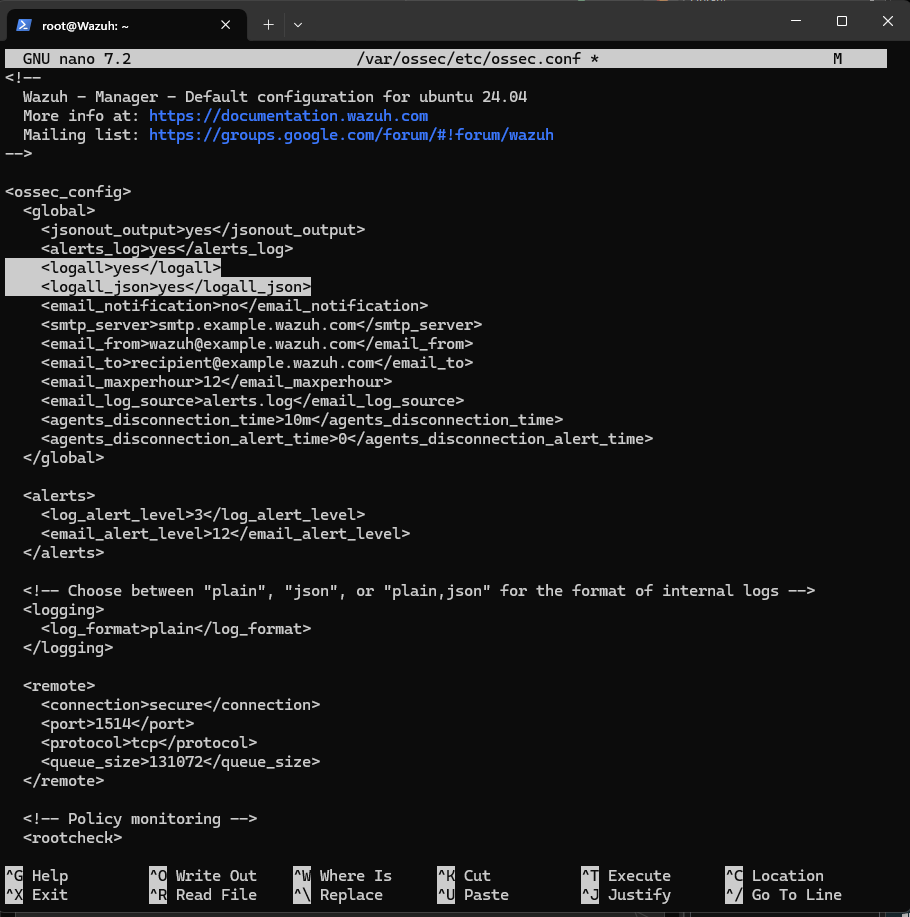
Enabling Full Logging in Wazuh
To capture all security events, we need to configure Wazuh to archive all logs:
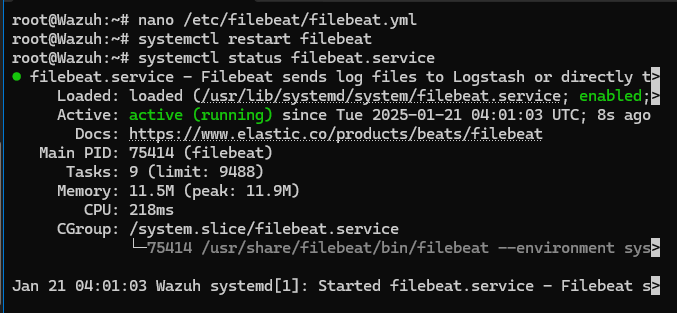
1. Modify Filebeat Configuration (on Wazuh Manager):
1
sudo nano /etc/filebeat/filebeat.yml
Find the filebeat.modules section and enable archives:
1
2
3
4
filebeat.modules:
  - module: wazuh
    archives:
      enabled: true
What is Filebeat? Filebeat is a lightweight data shipper that forwards and centralizes log data. It monitors log files, collects events, and forwards them to Elasticsearch for indexing.
2. Configure Archive Location (ossec.conf):
1
sudo nano /var/ossec/etc/ossec.conf
Logs will be saved in /var/ossec/logs/archives/
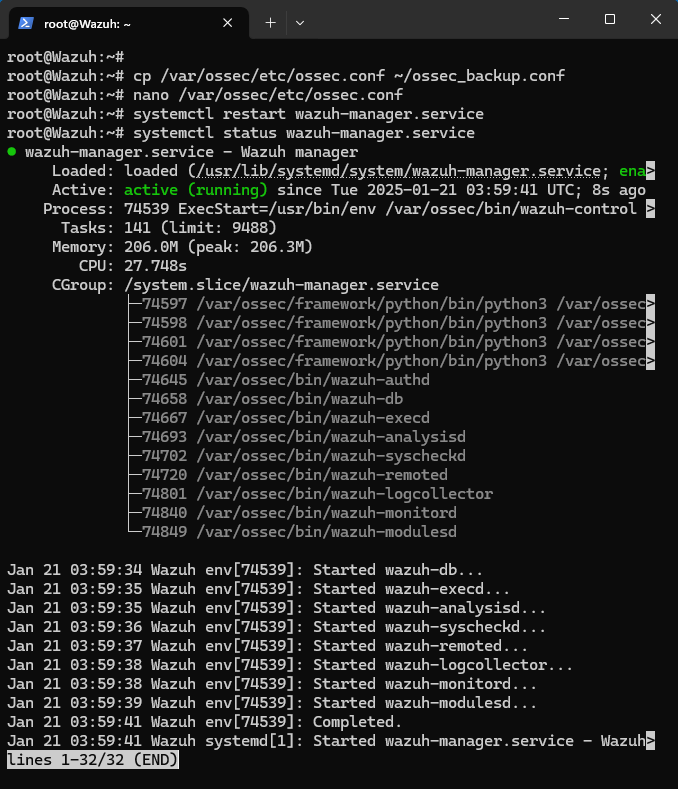
3. Restart Wazuh Manager:
1
sudo systemctl restart wazuh-manager
Understanding Log Indexing
Indexing organizes log data to enable faster searches by creating data structures that reduce scan time during queries.
Benefits:
- Reduced resource usage
- Faster pattern analysis
- Easier issue identification
Watch for: Duplicate log entries may indicate misconfigurations that waste storage space.
Testing Mimikatz Detection
- Run Mimikatz on the Windows agent:
1
.\mimikatz.exe
- Open Event Viewer
- Navigate to Windows Logs → Security
- Look for Event ID 1 (Process Create)
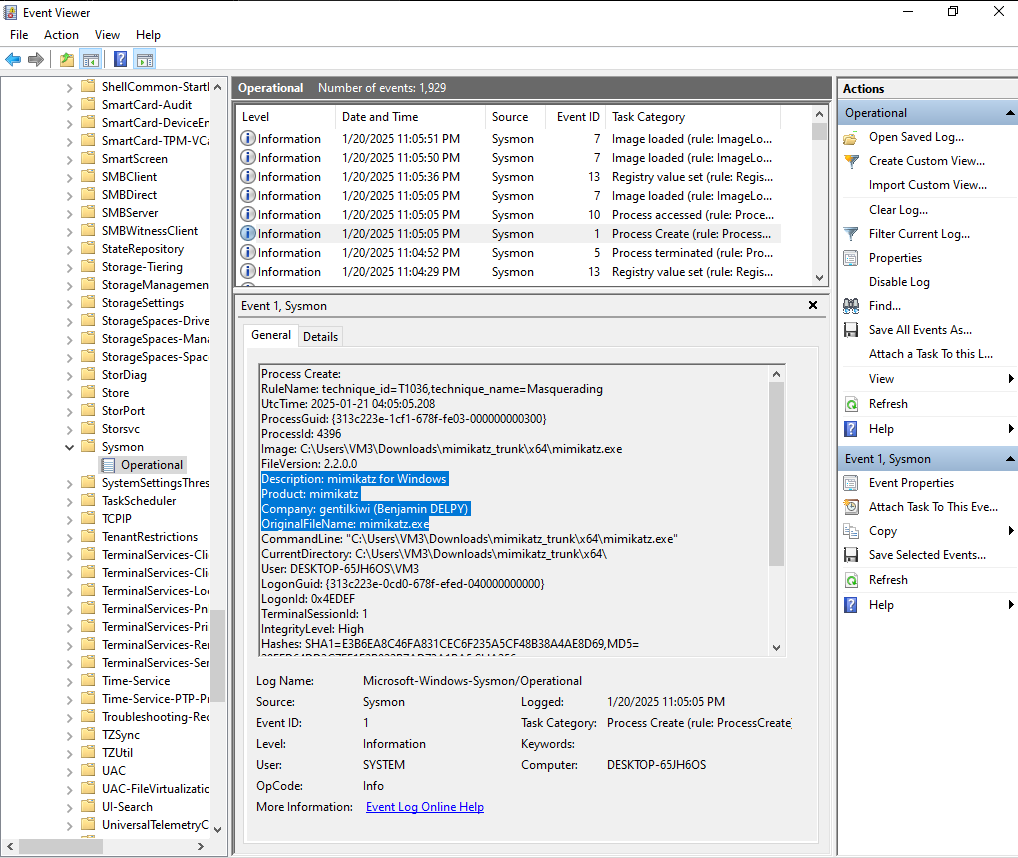
- Check Wazuh Dashboard for the alert
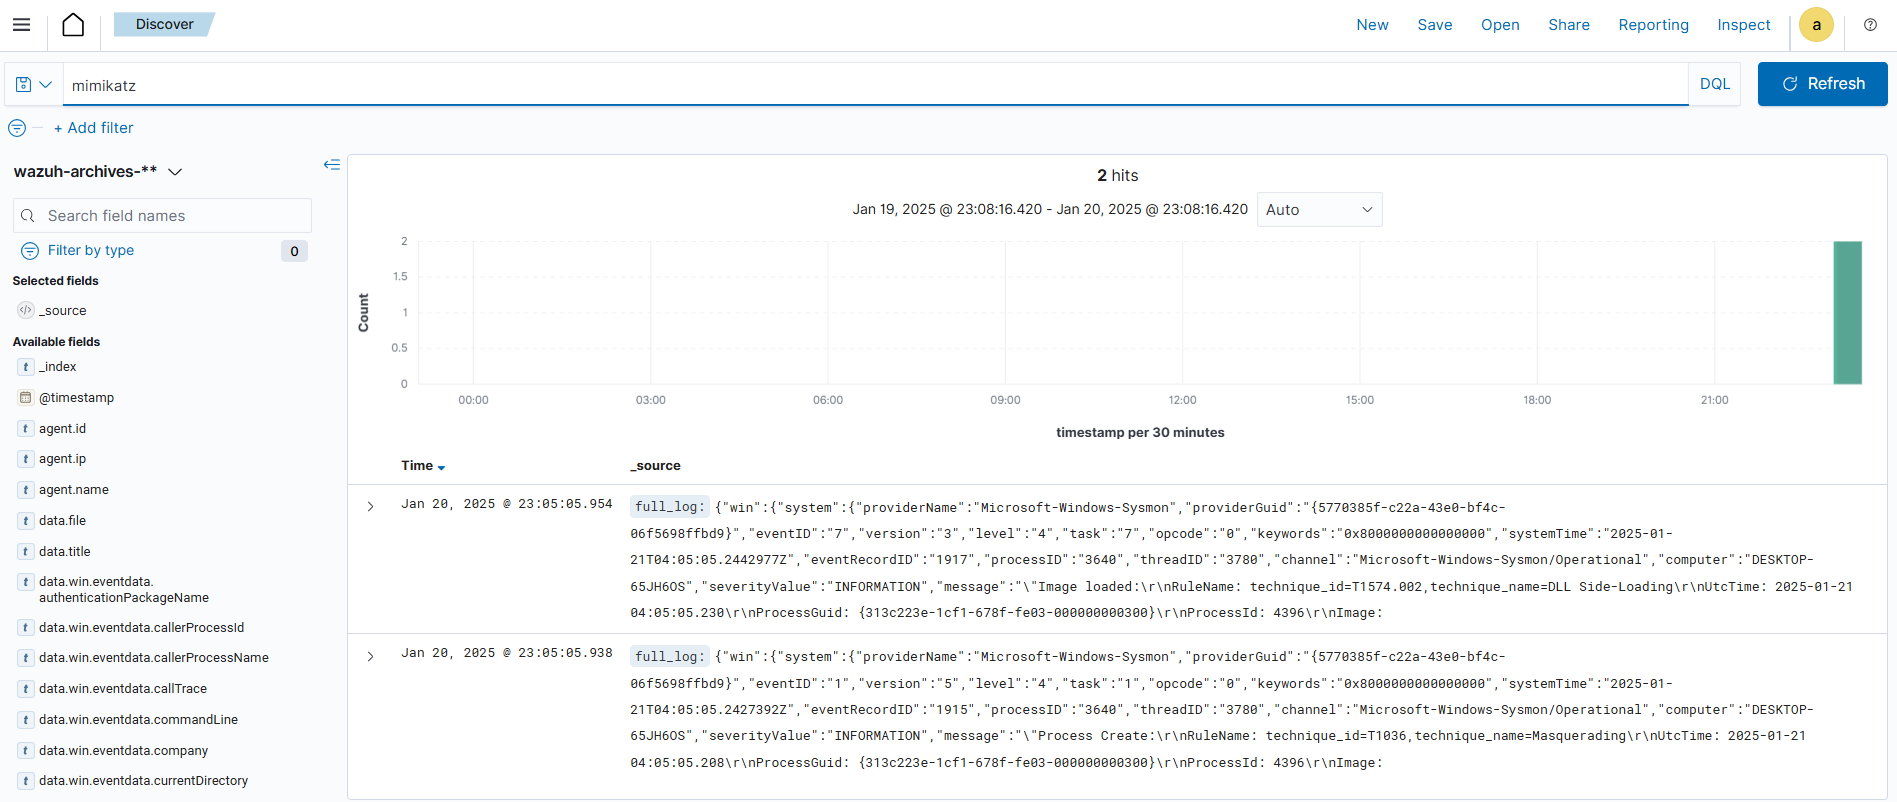
The alert confirms that Wazuh successfully detected the Mimikatz execution.
Part 7: Creating Custom Detection Rules
Why Custom Rules Matter
Challenge: What if an attacker renames mimikatz.exe to notepad.exe? Solution: Create a custom rule that detects Mimikatz based on file metadata, not just the filename.
Understanding the Wazuh Ruleset
The Wazuh ruleset is a collection of predefined conditions and patterns written in XML format that analyze incoming log data.
Components:
- Rules: XML elements defining detection conditions
- Decoders: Parse raw logs into structured format
- Rule Groups: Organize rules by function or event type
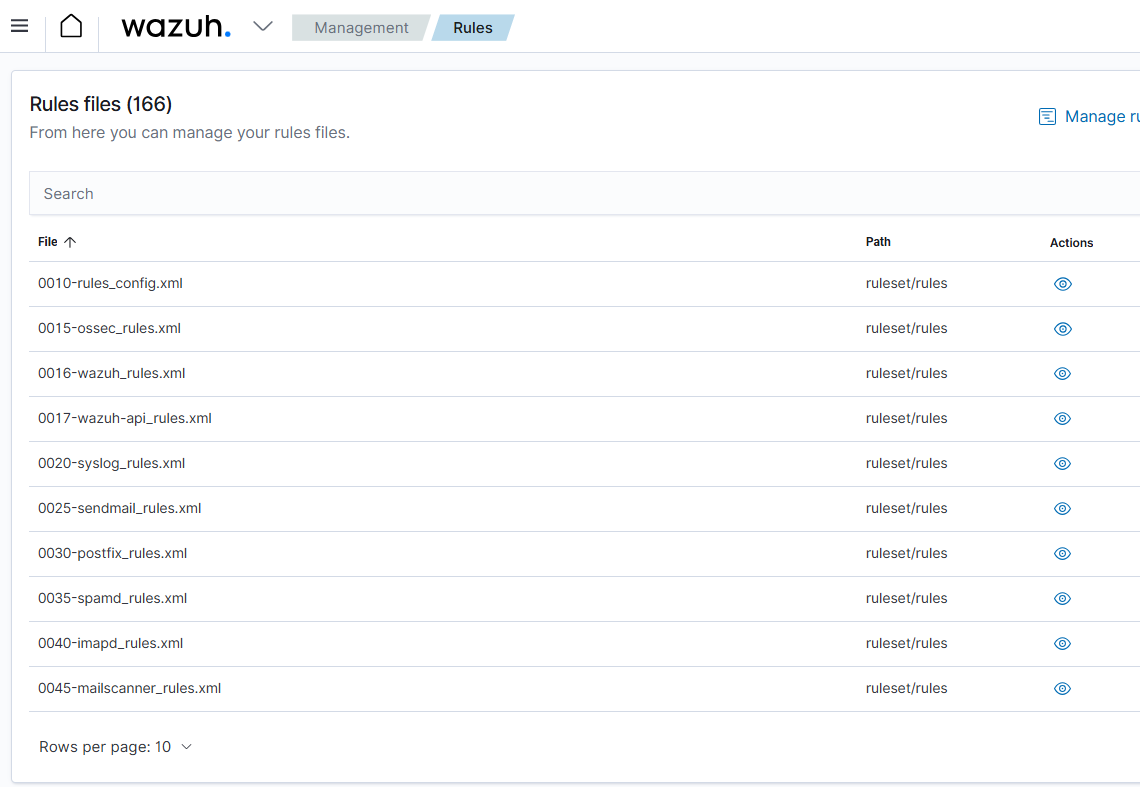
Accessing Rules:
- Wazuh Dashboard → Management → Rules
- Select “Manage rules files”
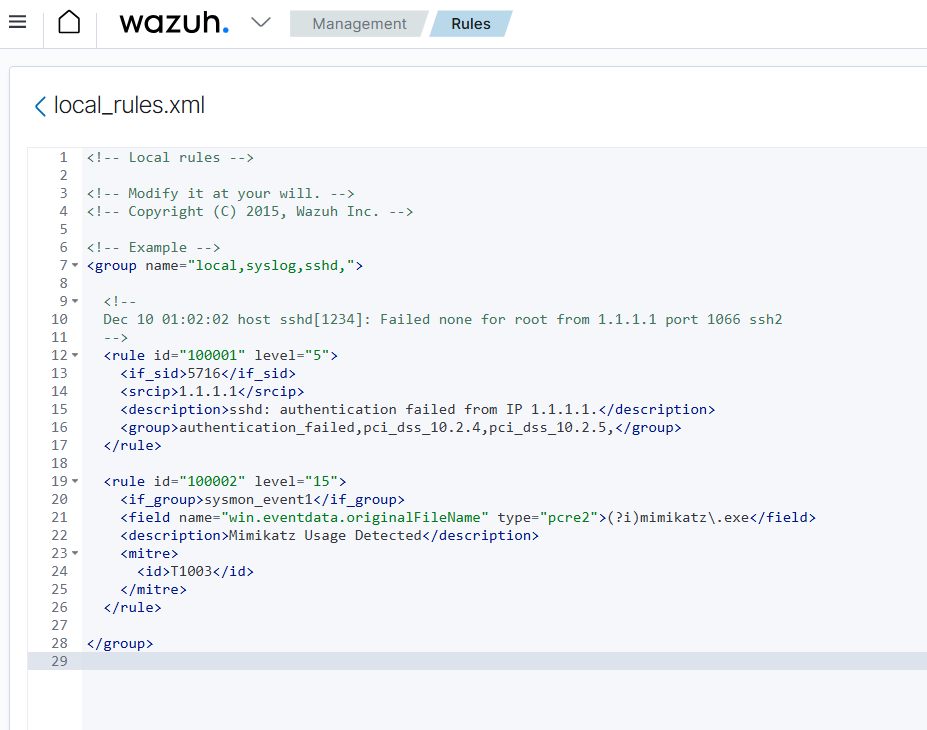
Creating the Mimikatz Detection Rule
Rule Structure:
1
2
3
4
5
6
7
8
<rule id="100002" level="15">
  <if_group>sysmon_event1</if_group>
  <field name="win.eventdata.originalFileName">mimikatz.exe</field>
  <description>Mimikatz detected - Credential Dumping Attempt</description>
  <mitre>
    <id>T1003</id>
  </mitre>
</rule>
Rule Components:
- ID: Custom rules start at 100000
- Level: Severity from 0-15 (15 = critical)
- Field: Checks
win.eventdata.originalFileName(case-sensitive) - MITRE ATT&CK: Maps to T1003 (OS Credential Dumping)
Implementation:
- Create a custom rules file or edit an existing one
- Add the rule XML
- Save the file
- Restart Wazuh Manager when prompted
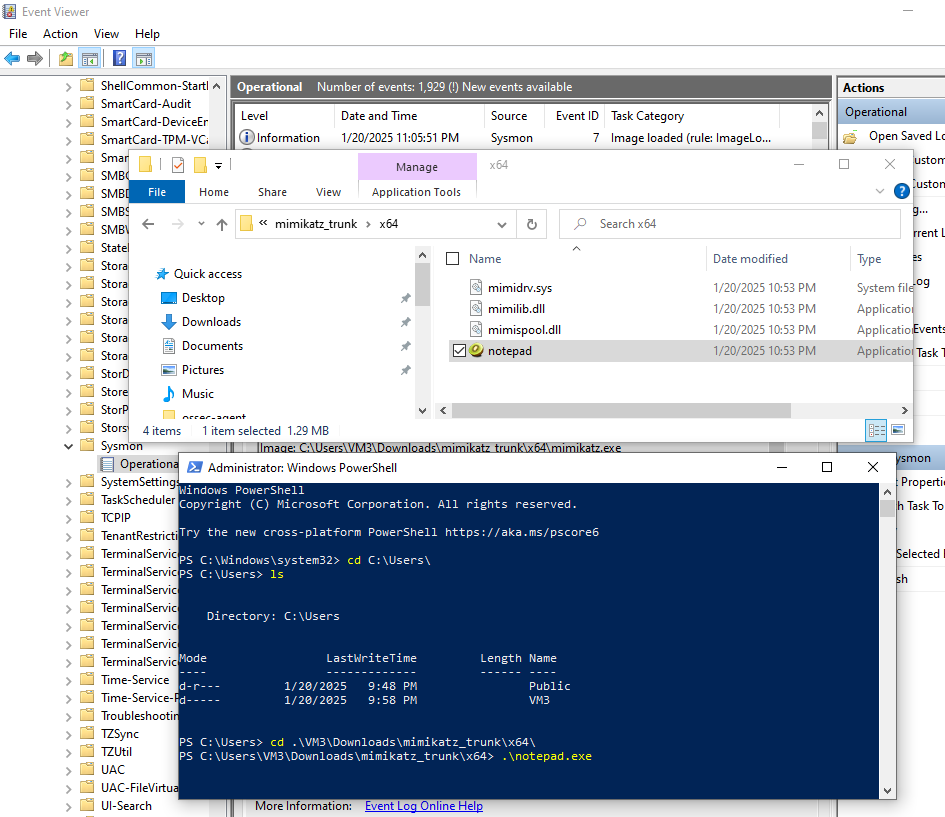
Testing Renamed Mimikatz
- Rename
mimikatz.exetonotepad.exe - Execute the renamed file
- Check Wazuh Dashboard
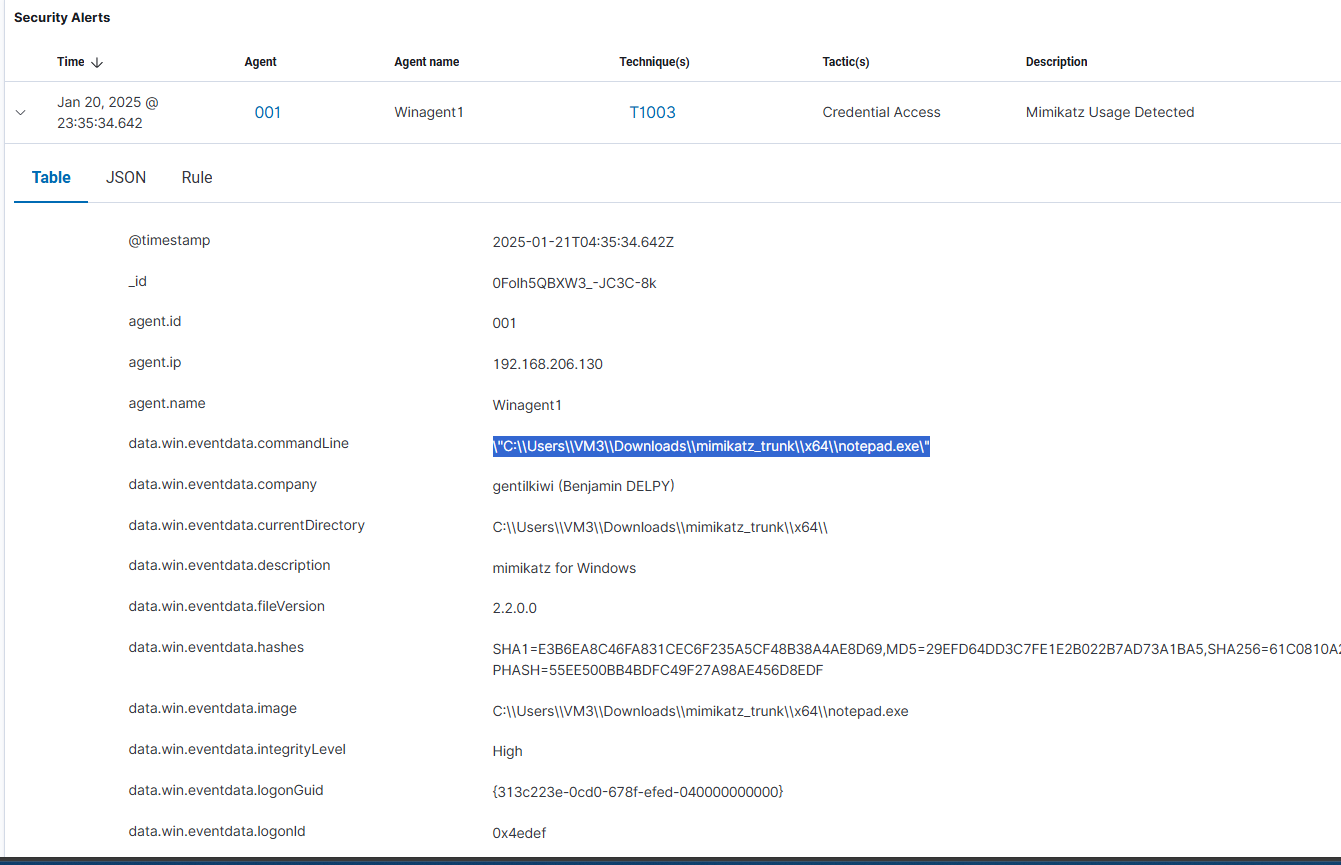
Result: The rule successfully detected Mimikatz even though the filename was changed. This is because the detection uses the original file name stored in the PE (Portable Executable) header metadata, which Sysmon captures.
Part 8: Security Orchestration with Shuffle
What is SOAR?
SOAR (Security Orchestration, Automation and Response) platforms streamline security operations by automating repetitive tasks and coordinating responses across multiple tools.
Shuffle is an open-source SOAR platform with a user-friendly interface that makes automation accessible for security teams of all skill levels.
Understanding Workflows
A workflow is a series of automated steps executed in a specific sequence to accomplish security tasks.
Workflow Components:
| Component | Purpose |
|---|---|
| Apps | Perform specific actions (API calls, data transformations) |
| Triggers | Initiate workflows based on events, time, or conditions |
| Variables | Store and reuse data throughout the workflow |
| Conditions | Control flow based on logic (if/then/else) |
Example Workflow:
1
2
3
4
5
6
7
8
9
10
11
Trigger: SIEM alert detected
   ↓
Enrichment: Query VirusTotal for threat intelligence
   ↓
Detection: Check if hash matches known malware
   ↓
Decision: Threat detected?
   ├─ YES → Isolate affected system + Create TheHive case
   └─ NO → Log and dismiss
   ↓
Verification: Confirm threat mitigated
Setting Up Shuffle Workflow
1. Create a New Workflow:
- Access Shuffle at
http://<shuffle-server>:3001 - Create a new workflow named “Wazuh to TheHive”
- Add a Webhook trigger
2. Integrate Wazuh with Shuffle:
Edit Wazuh’s configuration to send alerts to Shuffle:
1
sudo nano /var/ossec/etc/ossec.conf
Add the integration block:
1
2
3
4
5
6
<integration>
  <name>shuffle</name>
  <hook_url>http://<SHUFFLE_IP>:3001/api/v1/hooks/webhook_<YOUR_WEBHOOK_ID></hook_url>
  <level>3</level>
  <alert_format>json</alert_format>
</integration>
- level: Only forward alerts at severity level 3 or higher
- alert_format: Send alerts in JSON format
3. Restart Wazuh Manager:
1
sudo systemctl restart wazuh-manager
4. Test the Integration:
- Run Mimikatz (renamed as
notepad.exe) on the Windows agent - In Shuffle, start the Webhook
- Select “Show executions”
- Verify you see the Wazuh alert
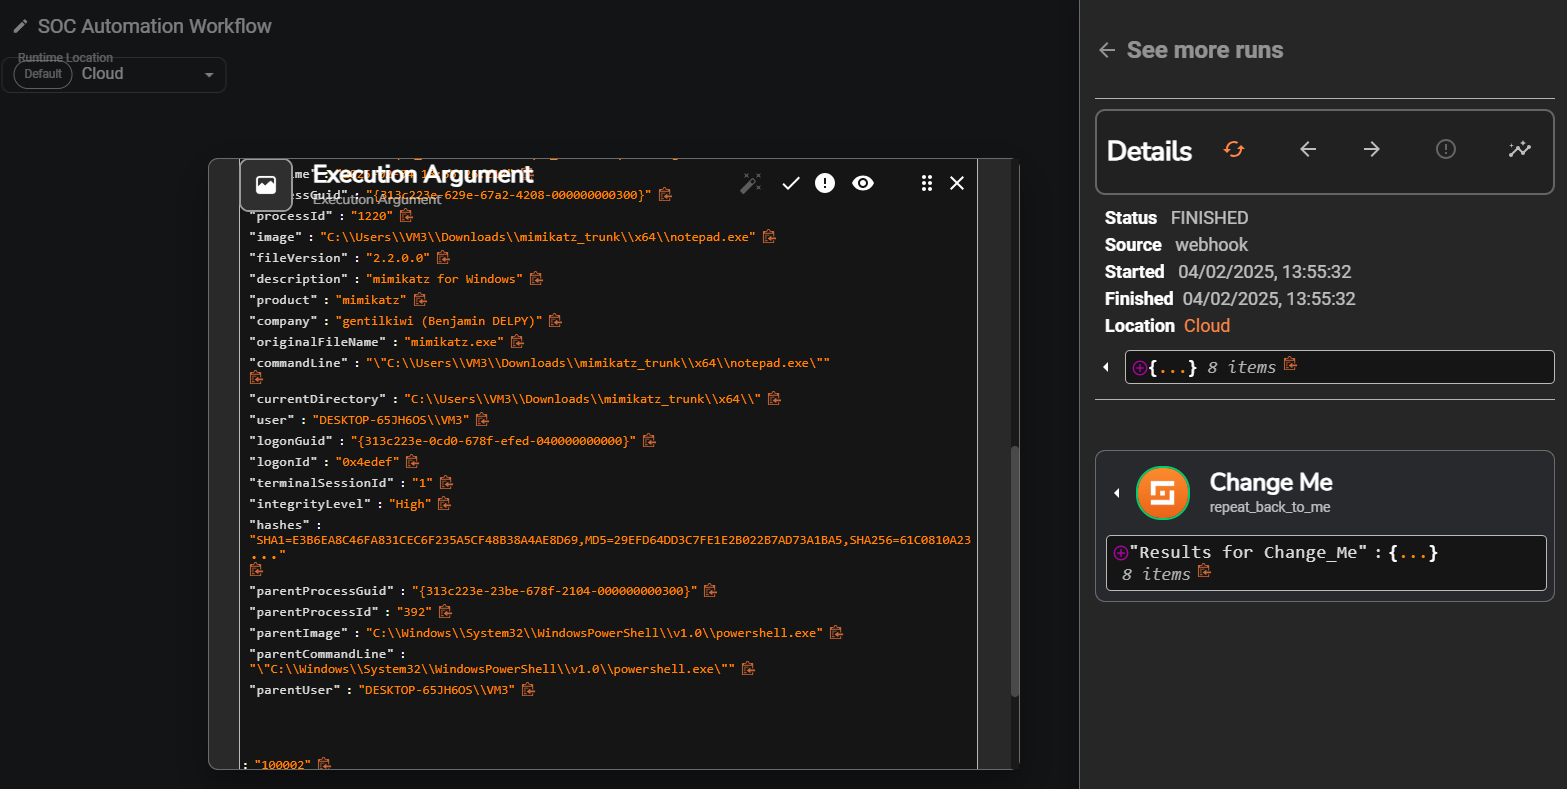
Success Indicator: You should see alert data containing “mimikatz” or “T1003” in the execution details.
Part 9: Complete SOAR Automation Workflow
Workflow Overview
Our complete automation workflow will:
- Receive alerts from Wazuh via webhook
- Extract file hash from the alert
- Enrich with VirusTotal threat intelligence
- Analyze the enrichment data
- Create a case in TheHive if threat is confirmed
- Notify the security team
Step 1: Parse Wazuh Alert
Shuffle App: JSON Parse Purpose: Extract relevant fields from the Wazuh alert
Configuration:
1
2
3
4
5
6
7
8
9
{
  "alert_id": "$exec.text.id",
  "agent_name": "$exec.text.agent.name",
  "rule_description": "$exec.text.rule.description",
  "rule_level": "$exec.text.rule.level",
  "file_hash": "$exec.text.data.win.eventdata.hashes",
  "original_file_name": "$exec.text.data.win.eventdata.originalFileName",
  "process_command_line": "$exec.text.data.win.eventdata.commandLine"
}
Step 2: Extract SHA256 Hash
Shuffle App: Regex Purpose: Extract only the SHA256 hash from the hashes field
Pattern: SHA256=([A-Fa-f0-9]{64})
Output Variable: $sha256_hash
Step 3: Query VirusTotal
Shuffle App: VirusTotal Purpose: Check if the file hash is known malware
Prerequisites:
- Create a free VirusTotal account
- Generate an API key from your account settings
- Add the API key to Shuffle’s VirusTotal app configuration
Configuration:
- Action: Get File Report
- Resource:
$sha256_hash - API Key:
<YOUR_VIRUSTOTAL_API_KEY>
Response Data:
1
2
3
4
5
6
{
  "positives": <number of AV engines that flagged as malicious>,
  "total": <total AV engines>,
  "permalink": "<link to VT report>",
  "scan_date": "<when file was last scanned>"
}
Step 4: Conditional Check
Shuffle App: Condition Purpose: Only create TheHive case if threat is confirmed
Logic:
1
2
3
4
5
IF $virustotal.positives > 5 THEN
  Proceed to TheHive case creation
ELSE
  Log and end workflow
END IF
Explanation: We consider a file malicious if more than 5 antivirus engines detected it. Adjust this threshold based on your organization’s risk tolerance.
Step 5: Create TheHive Case
Shuffle App: TheHive Purpose: Create an incident case for investigation
Prerequisites:
- Create an API key in TheHive:
- Login → Organization → Users → Create API Key
- Add TheHive app credentials in Shuffle
Case Configuration:
1
2
3
4
5
6
7
8
9
10
11
12
13
14
{
  "title": "Mimikatz Detection - $alert.agent_name",
  "description": "Wazuh detected potential credential dumping activity.\n\n**Alert Details:**\n- Alert ID: $alert.alert_id\n- Rule: $alert.rule_description\n- Severity: $alert.rule_level\n- Agent: $alert.agent_name\n\n**File Information:**\n- Original Name: $alert.original_file_name\n- SHA256: $sha256_hash\n- VirusTotal Detections: $virustotal.positives/$virustotal.total\n- VT Report: $virustotal.permalink\n\n**Process Details:**\n- Command Line: $alert.process_command_line",
  "severity": 3,
  "tlp": 2,
  "tags": ["mimikatz", "credential-dumping", "T1003", "automated"],
  "tasks": [
    {"title": "Review VirusTotal report", "status": "Waiting"},
    {"title": "Isolate affected endpoint", "status": "Waiting"},
    {"title": "Check for lateral movement", "status": "Waiting"},
    {"title": "Review authentication logs", "status": "Waiting"},
    {"title": "Document findings", "status": "Waiting"}
  ]
}
Field Explanations:
- severity: 1 (Low) to 4 (Critical)
- tlp: Traffic Light Protocol - 0 (White) to 4 (Red)
- tags: Categorize the case for easy filtering
- tasks: Pre-defined investigation steps
Step 6: Add Observables to TheHive
Shuffle App: TheHive (Add Observable) Purpose: Attach IOCs (Indicators of Compromise) to the case
Observables to Add:
- File Hash (SHA256):
1
2
3
4
5
6
7
{
  "dataType": "hash",
  "data": "$sha256_hash",
  "message": "Malicious file hash detected by Wazuh",
  "tags": ["mimikatz"],
  "ioc": true
}
- Filename (Original):
1
2
3
4
5
6
7
{
  "dataType": "filename",
  "data": "$alert.original_file_name",
  "message": "Original filename from PE header",
  "tags": ["executable"],
  "ioc": true
}
- Hostname:
1
2
3
4
5
6
7
{
  "dataType": "hostname",
  "data": "$alert.agent_name",
  "message": "Affected endpoint",
  "tags": ["infected-host"],
  "ioc": false
}
Step 7: Send Email Notification
Shuffle App: Email Purpose: Alert the SOC team immediately
Configuration:
1
2
3
4
5
6
7
8
9
10
11
12
13
14
15
16
17
18
19
20
21
22
23
24
25
26
27
To: soc-team@company.com
Subject: [CRITICAL] Mimikatz Detected - Immediate Action Required
Body:
SECURITY ALERT

A high-severity security event has been automatically detected and investigated.

**Incident Summary:**
- Threat: Credential Dumping Tool (Mimikatz)
- Affected System: $alert.agent_name
- Detection Time: $timestamp
- MITRE ATT&CK: T1003 (OS Credential Dumping)

**Threat Intelligence:**
- VirusTotal Detections: $virustotal.positives/$virustotal.total engines
- Report: $virustotal.permalink

**Immediate Actions:**
1. Endpoint has NOT been automatically isolated
2. Investigate authentication logs for suspicious activity
3. Check for lateral movement indicators
4. Review TheHive case for full details: $thehive_case_url

**TheHive Case:** $thehive_case_url

---
This alert was generated automatically by the SecureYourGear SOC Automation Platform.
What Happens on the Receiving End:
The SOC team receives this email within 60-90 seconds of detection. The analyst gets immediate context including threat severity, affected system, VirusTotal validation (typically 60+ detections), and clickable links to both the VirusTotal report and TheHive case. This eliminates manual pivoting between systems - the case is already created with observables attached and investigation tasks defined.
Traditional manual workflow takes 35-60 minutes from alert to case creation. Automation reduces this to 90 seconds, enabling the team to focus on investigation and response rather than data gathering and ticket creation.
Step 8: Log to SIEM (Optional)
Shuffle App: HTTP Request Purpose: Send workflow results back to Wazuh for centralized logging
Configuration:
1
2
3
4
5
6
7
8
9
10
11
12
13
14
15
{
  "method": "POST",
  "url": "http://<WAZUH_MANAGER>:55000/security/events",
  "headers": {
    "Authorization": "Bearer <WAZUH_API_TOKEN>"
  },
  "body": {
    "type": "soar_workflow_complete",
    "workflow_name": "mimikatz_detection",
    "case_created": true,
    "case_url": "$thehive_case_url",
    "vt_detections": "$virustotal.positives",
    "timestamp": "$timestamp"
  }
}
Part 10: Testing the Complete Workflow
Pre-Flight Checklist
Before testing, verify all components are operational:
Wazuh:
1
sudo systemctl status wazuh-manager
TheHive:
1
sudo systemctl status cassandra elasticsearch thehive
Shuffle:
- Access the web interface
- Ensure workflow is saved and activated
- Verify all app credentials are configured
Execution Test
1. Start Monitoring:
- Open Wazuh Dashboard → Events
- Open TheHive → Cases
- Open Shuffle → Workflow Executions
- Keep all three tabs visible
2. Trigger the Alert:
On the Windows agent:
- Rename
mimikatz.exetocalculator.exe(to test metadata detection) - Execute the file
- Run any Mimikatz command (e.g.,
privilege::debug)
3. Observe the Automation:
Within 10 seconds: Wazuh alert appears Within 30 seconds: Shuffle workflow executes Within 60 seconds: TheHive case is created Within 90 seconds: Email notification sent
Verification Steps
1. Check Wazuh Alert:
1
2
3
Rule: 100002 - Mimikatz detected
Level: 15 (Critical)
MITRE: T1003
2. Check Shuffle Execution:
- All apps should show green checkmarks
- VirusTotal results should show 60+ detections
- TheHive case ID should be returned
3. Check TheHive Case:
- Title includes agent name
- Description contains all alert details
- 5 tasks are created and waiting
- 3 observables are attached (hash, filename, hostname)
4. Check Email:
- Email received by SOC team
- Contains clickable links
- Shows VirusTotal detection count
This lab demonstrates SOC automation techniques used by security teams to protect organizations from credential theft, lateral movement, and advanced persistent threats.